You signed in with another tab or window. Reload to refresh your session.You signed out in another tab or window. Reload to refresh your session.You switched accounts on another tab or window. Reload to refresh your session.Dismiss alert
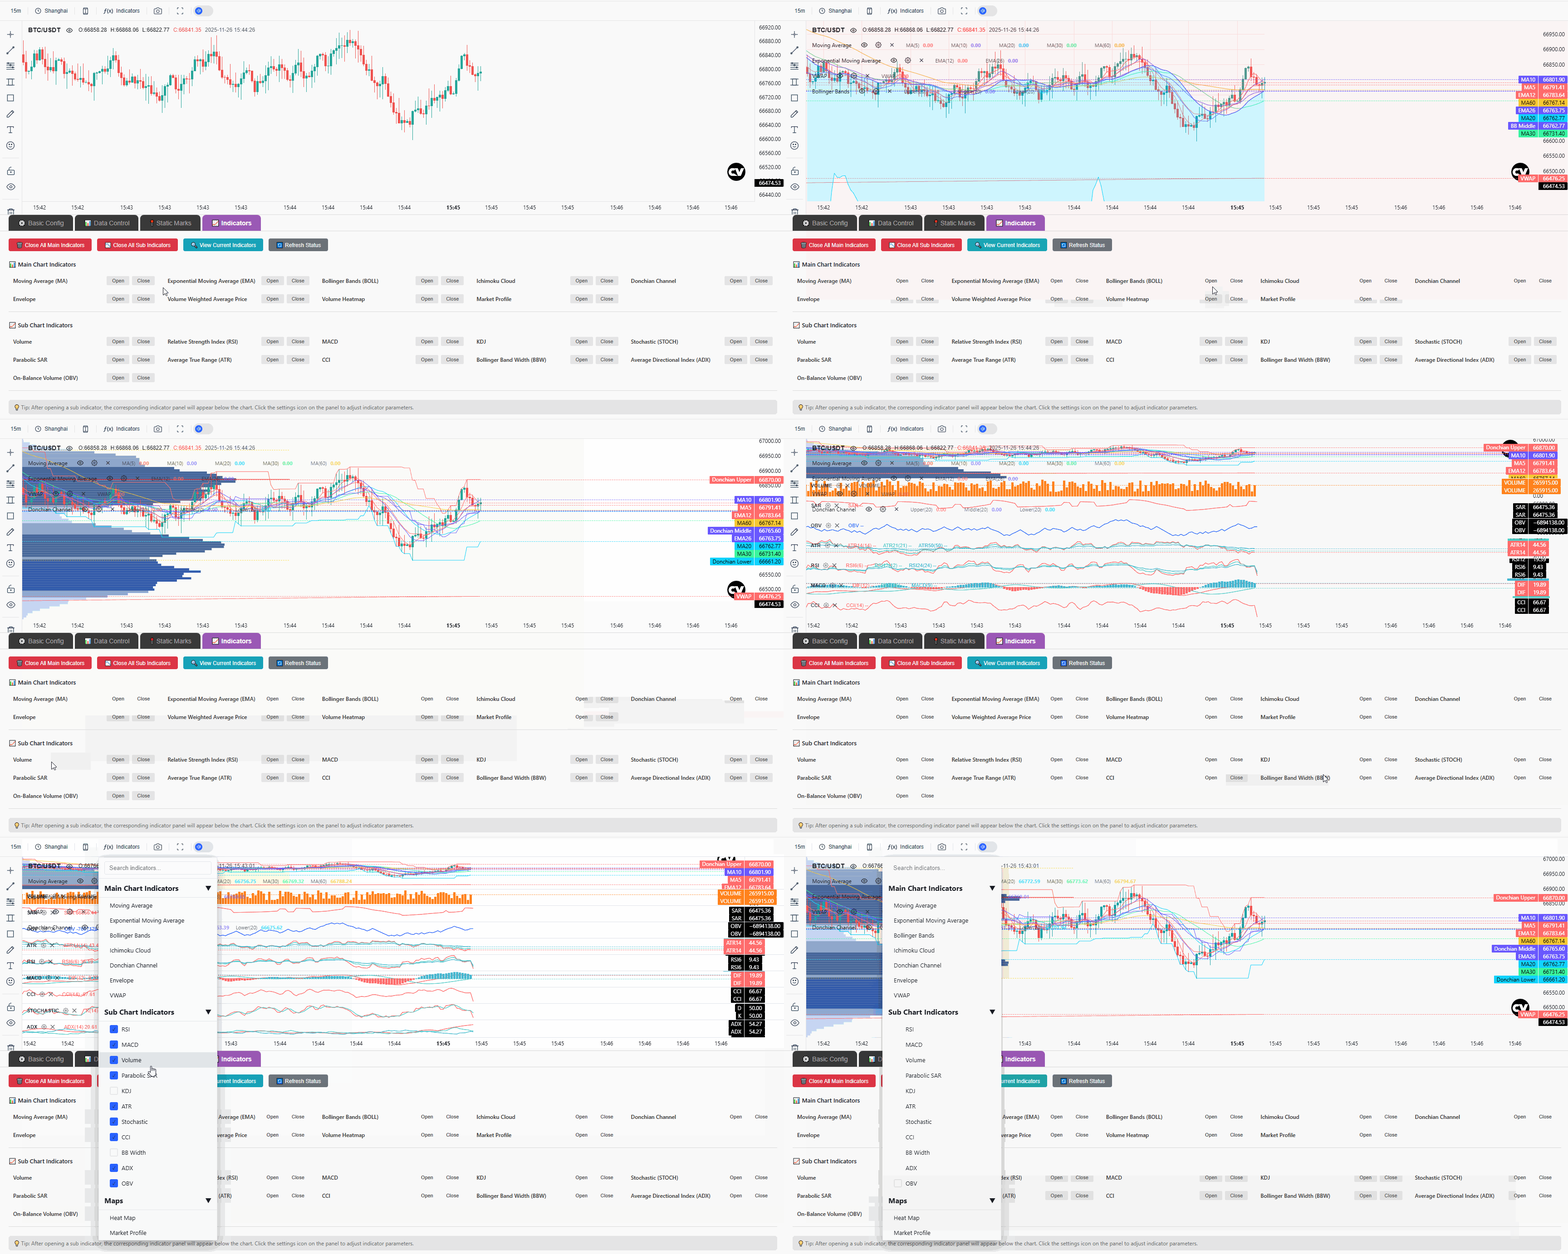
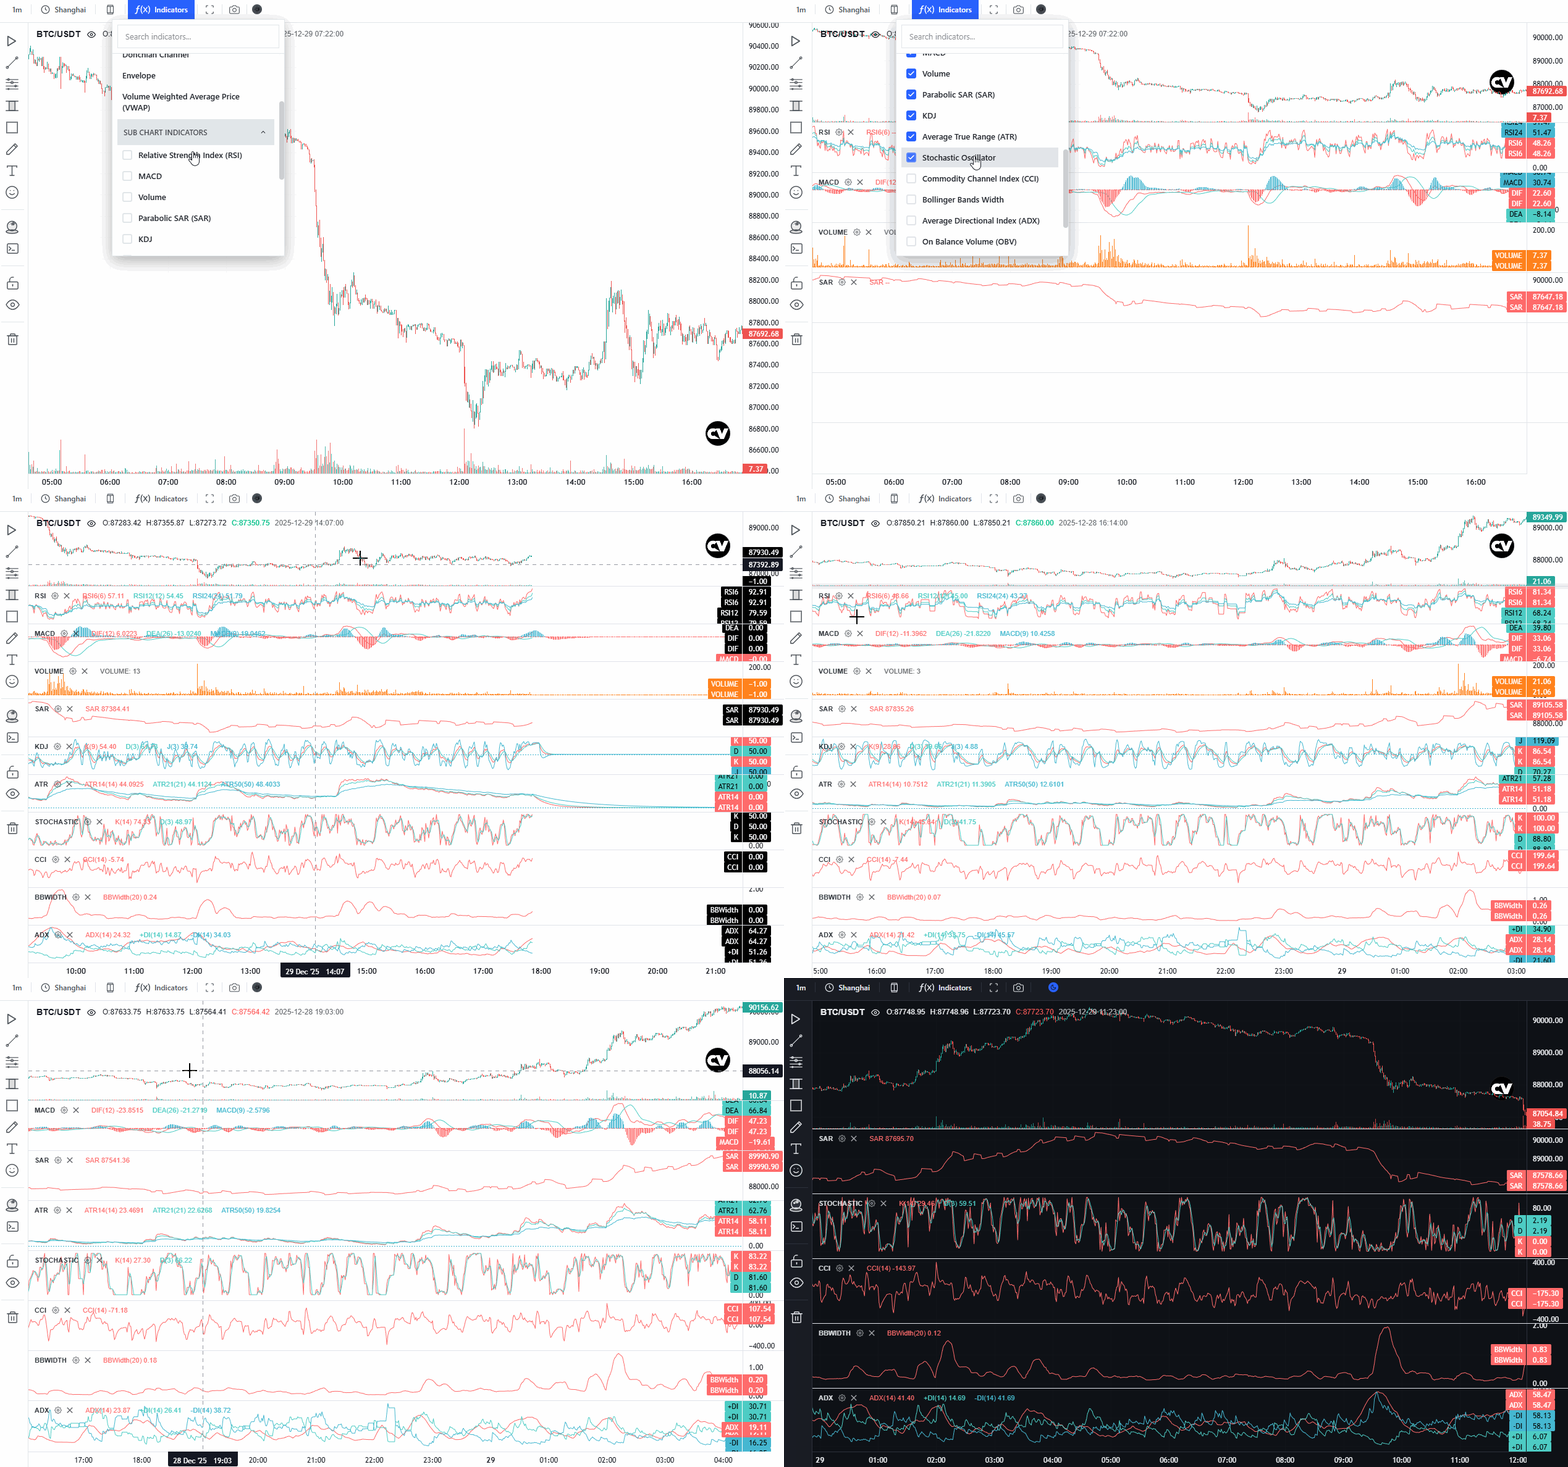
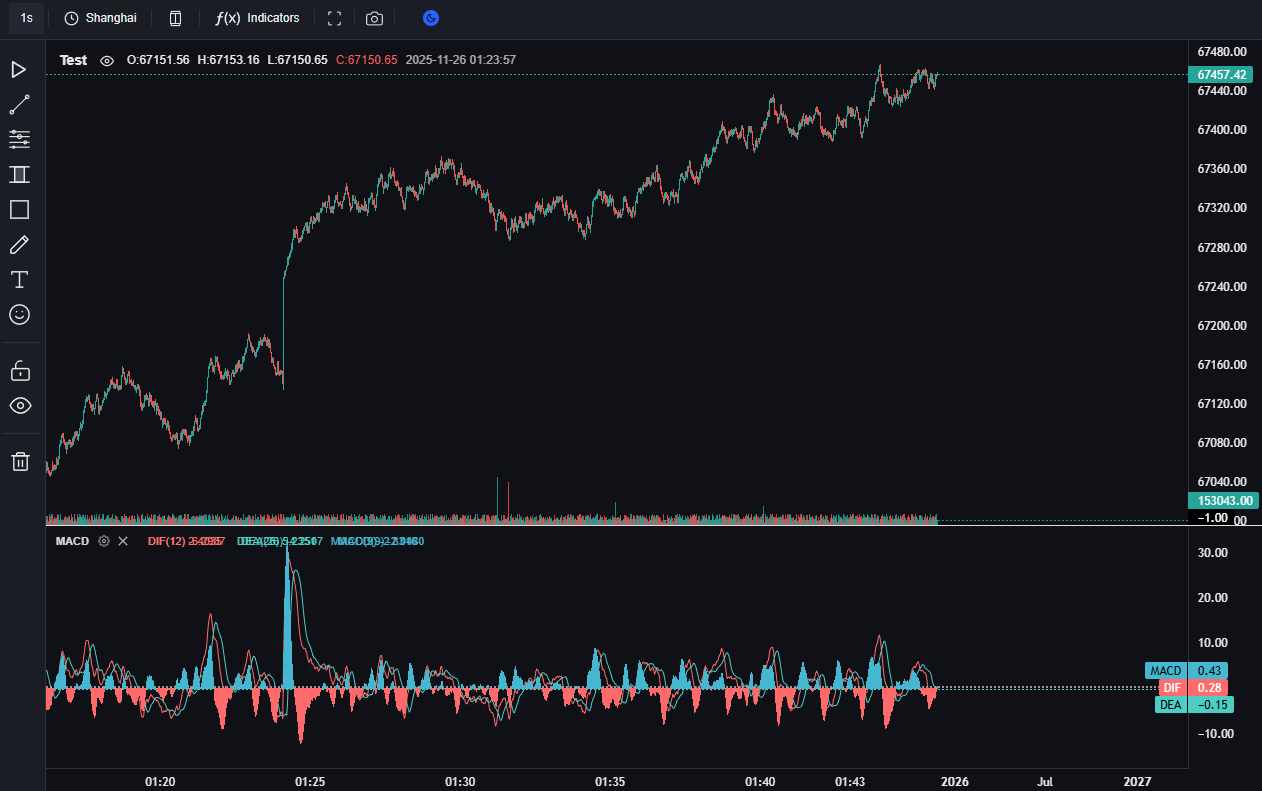
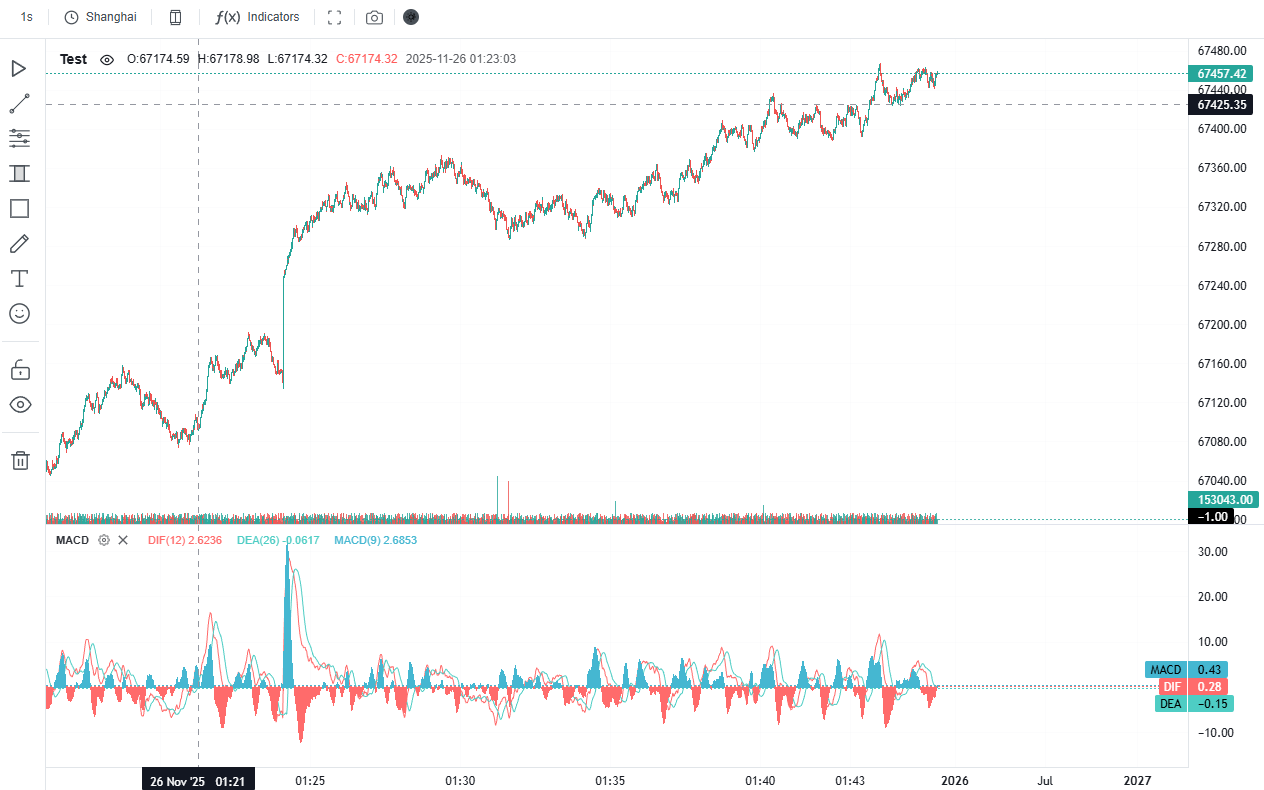
Open the main chart technical indicators and the sub-chart technical indicators
import{CandleView,MainChartIndicatorType,SubChartIndicatorType,}from"candleview";// 1. Initialize the chartconstcandleView=newCandleView({container: document.getElementById("chart"),title: "BTC/USDT",data: candleData,// Array of candlestick datatheme: "dark",locale: "en",});// ========== Main Chart Indicators ==========// Open MA indicator (Moving Average)candleView.openMainChartIndicator(MainChartIndicatorType.MA);// Open EMA indicator (Exponential Moving Average)candleView.openMainChartIndicator(MainChartIndicatorType.EMA);// Open Bollinger Bands indicatorcandleView.openMainChartIndicator(MainChartIndicatorType.BOLLINGER);// Open VWAP indicatorcandleView.openMainChartIndicator(MainChartIndicatorType.VWAP);// Close MA indicatorcandleView.closeMainChartIndicator(MainChartIndicatorType.MA);// Close all main chart indicatorscandleView.closeAllMainChartIndicators();// Check if an indicator is enabledconstisMAEnabled=candleView.isMainChartIndicatorEnabled(MainChartIndicatorType.MA,console.log("MA enabled:",isMAEnabled);// Get all enabled main chart indicatorsconstenabledIndicators=candleView.getEnabledMainChartIndicators();console.log("Enabled indicators:",enabledIndicators);// ========== Sub Chart Indicators ==========// Open RSI indicator (Relative Strength Index)candleView.openSubChartIndicator(SubChartIndicatorType.RSI);// Open MACD indicatorcandleView.openSubChartIndicator(SubChartIndicatorType.MACD);// Open Volume indicatorcandleView.openSubChartIndicator(SubChartIndicatorType.VOLUME);// Close RSI indicatorcandleView.closeSubChartIndicator(SubChartIndicatorType.RSI);// Close all sub chart indicatorscandleView.closeAllSubChartIndicators();// Check if an indicator is enabledconstisRSIEnabled=candleView.isSubChartIndicatorEnabled(SubChartIndicatorType.RSI,);// Get all enabled sub chart indicatorsconstenabledSubIndicators=candleView.getEnabledSubChartIndicators();// ========== Open with Callbacks (for settings modal) ==========candleView.openSubChartIndicator(SubChartIndicatorType.MACD,(type)=>{// Callback when indicator is opened (e.g., to show settings panel)console.log("MACD opened, ready to show settings");},(type)=>{// Callback when indicator is closedconsole.log("MACD closed");},);// ========== Destroy Chart ==========candleView.destroy();
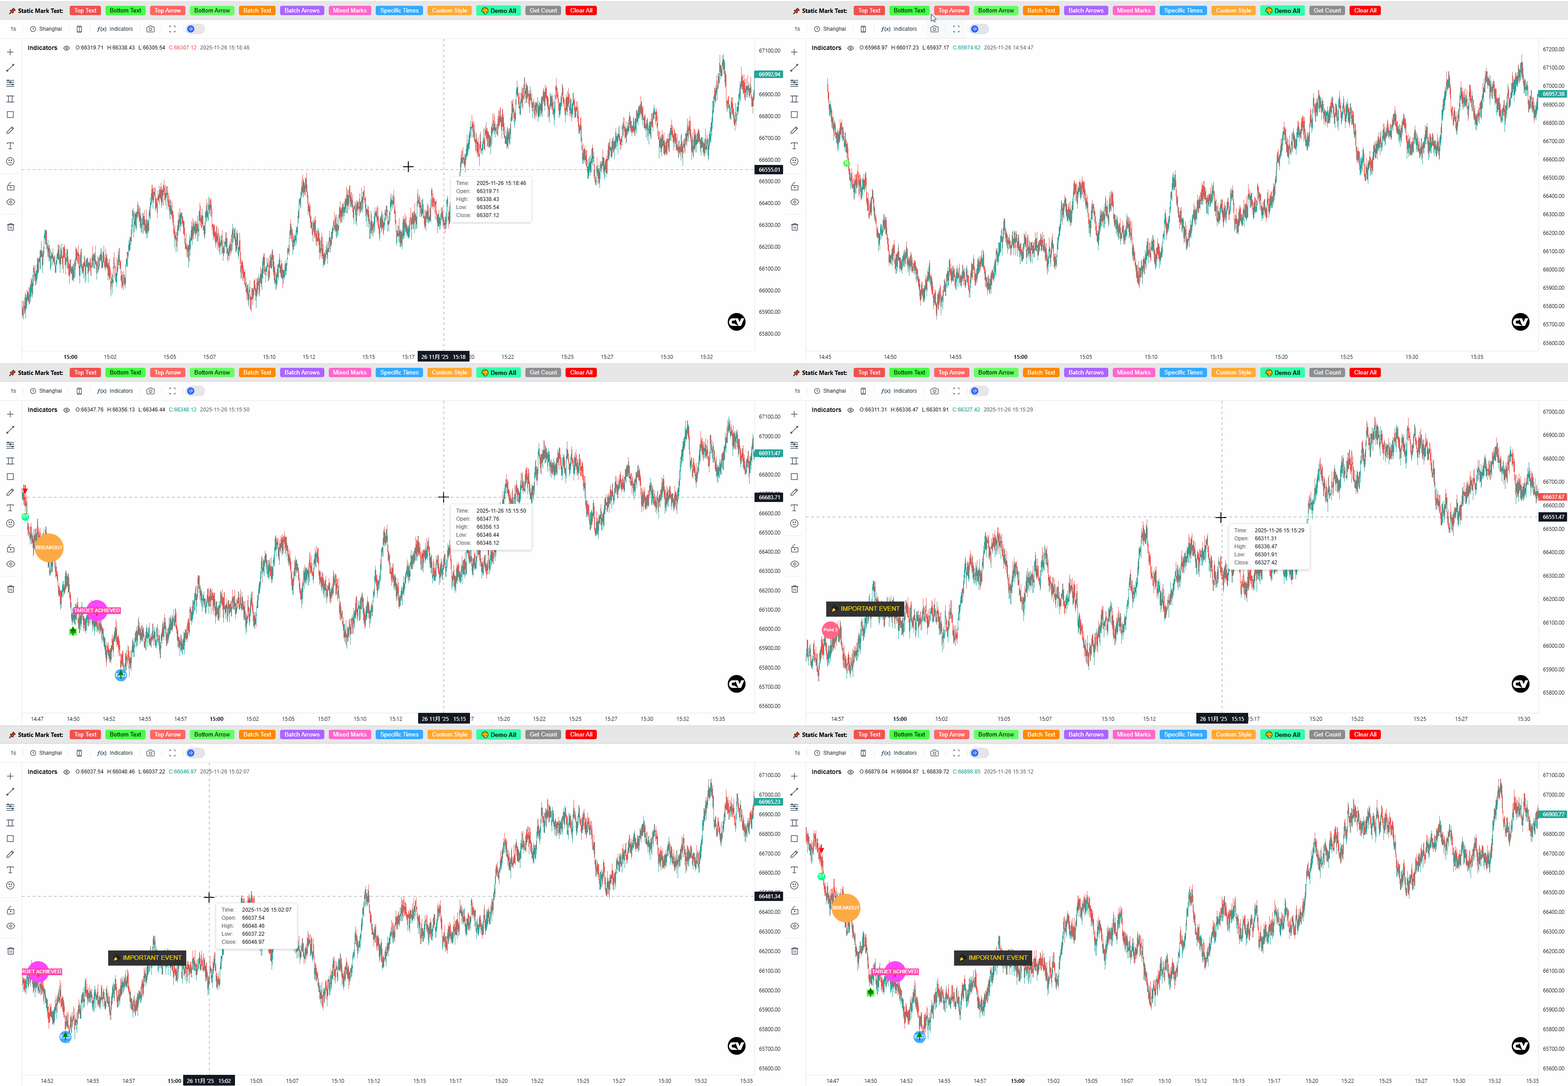
Static Mark
Static Mark Interface parameters
interfaceIStaticMarkOptions{textColor?: string;// Text color, default whitebackgroundColor?: string;// Background color, default red for Top, green for BottomisCircular?: boolean;// Circular background, default truefontSize?: number;// Font size, default 9-11padding?: number;// Padding, default 3label?: string;// Label text for arrow marks}
Example
Add Single Text Mark
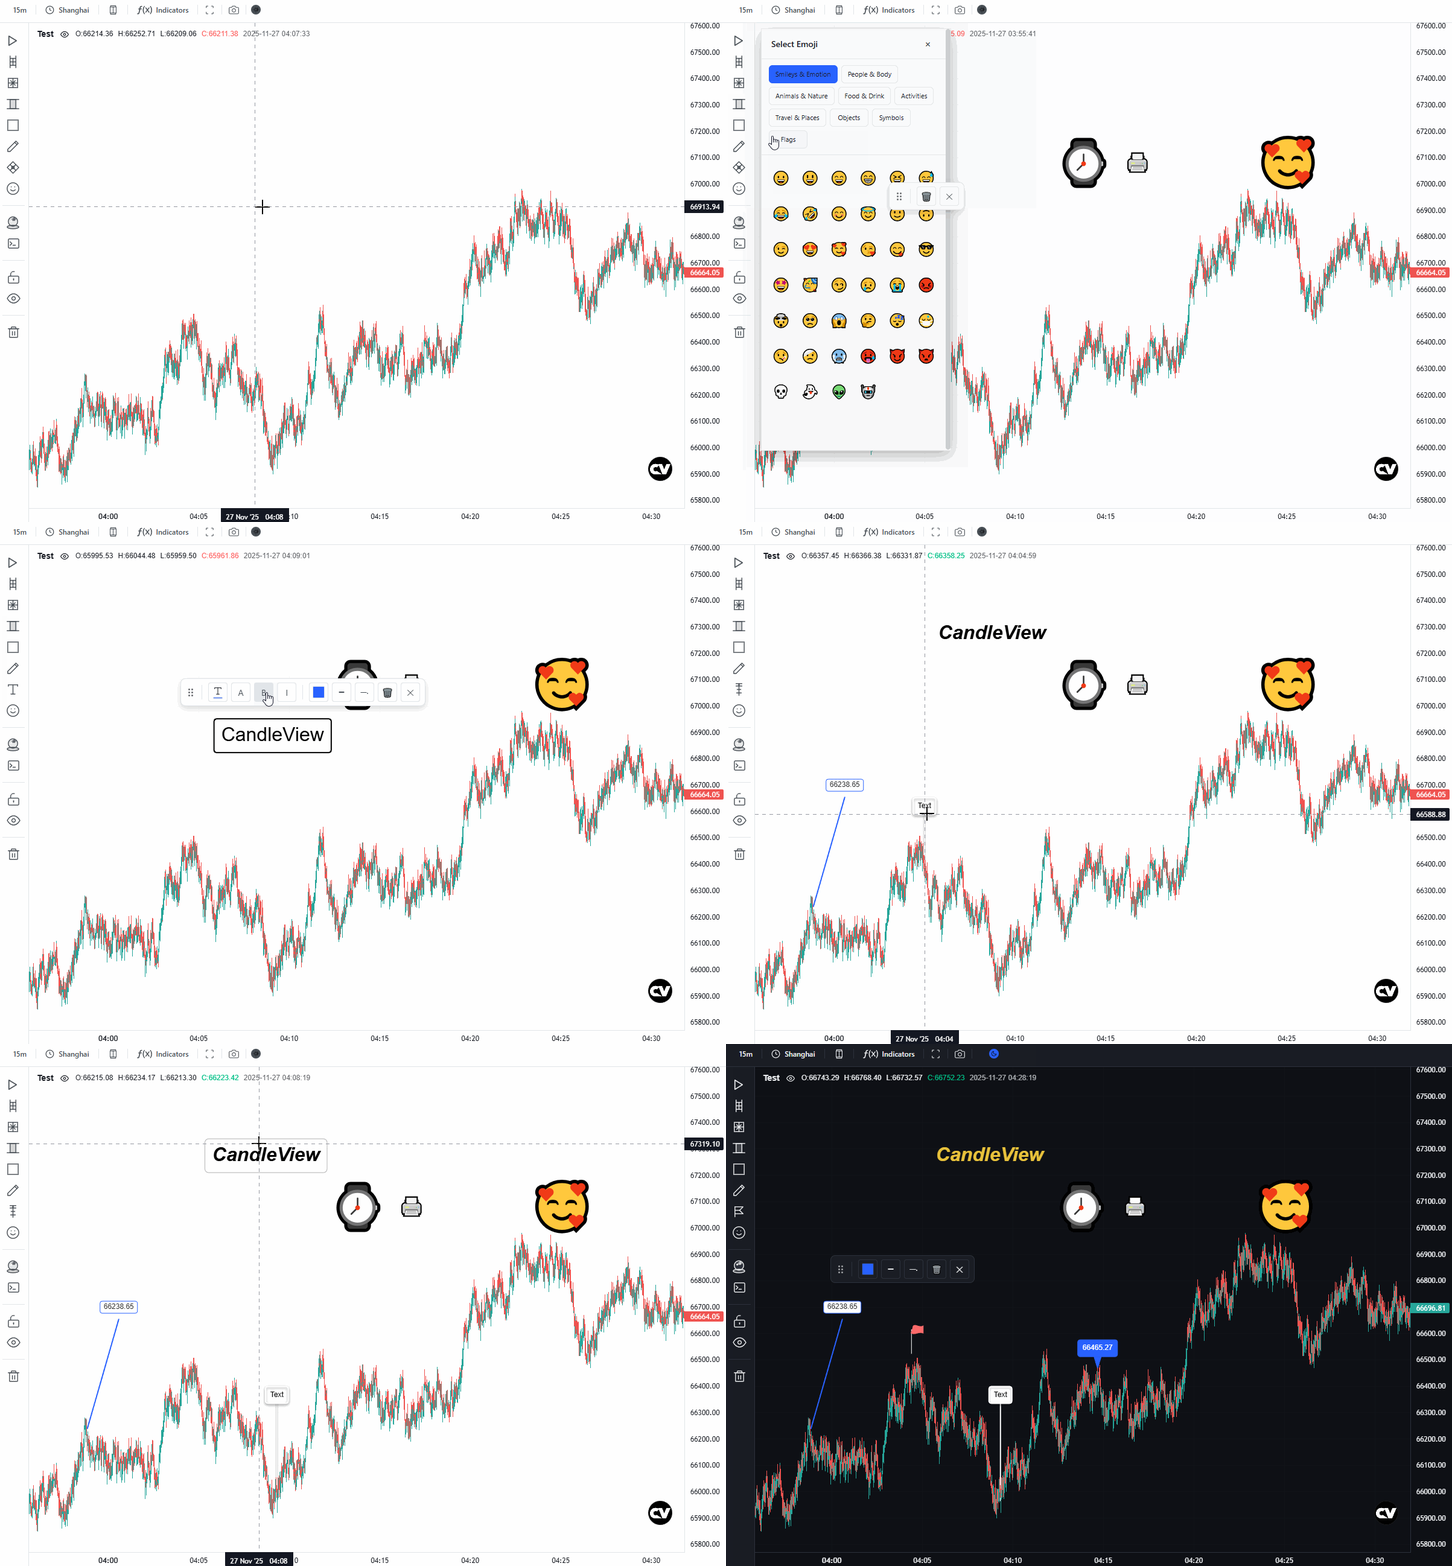
import{CandleView,StaticMarkDirection,StaticMarkType}from"candleview";// Create chart instanceconstchart=newCandleView({container: document.getElementById("chart"),title: "BTC/USDT",theme: "dark",data: yourKlineData,});// Top text mark (red background)chart.addTextMark(1704067200,// timestamp"📈 Resistance",// text contentStaticMarkDirection.Top,// direction: Top{textColor: "#ffffff",backgroundColor: "#ff4444",isCircular: true,fontSize: 10,padding: 4,},);// Bottom text mark (green background)chart.addTextMark(1704067300,"📉 Support",StaticMarkDirection.Bottom,{textColor: "#ffffff",backgroundColor: "#44ff44",isCircular: true,fontSize: 10,padding: 4,});
// Create chart instanceconstchart=newCandleView({container: document.getElementById("chart"),title: "BTC/USDT",theme: "dark",data: yourKlineData,});// Get mark countconstcount=chart.getStaticMarkCount();console.log(`Current mark count: ${count}`);// Clear all markschart.clearAllStaticMarks();