Multi-criteria habitat suitability for the lunar south pole, validated against authoritative USGS-published Artemis IV (formerly Artemis III) candidate region polygons (DOI 10.5066/P1MEQ6UK). v1.5 produces 69 HLS-compliant candidate landing sites across 8 of NASA's 9 Artemis IV candidate regions at 20 m resolution (Wueller-class); v1.8 activates the eighth (seismic) criterion on the same 69-site catalog, of which 56 (81.2 %) agree within 5 km of a peer-reviewed Wueller et al. 2026 site (JGR Planets, 130 sites); median match distance 1.69 km — quantitative agreement with peer-reviewed published methodology, computed against the authors' Zenodo data deposit (CC-BY 4.0). v1.5 ships GPU-accelerated horizon-profile derivation (CuPy on Blackwell) enabling per-region high-resolution analysis; v1.7 adds TOPSIS as an opt-in alternative aggregator; v1.8 lights up the eighth (seismic) criterion on a bundled south-polar scarp catalog. v2.0 — first NASA-HLS-alignment release — swaps the v1.x global spatial-coupling product for per-cell EVA-disc PSR access (cold-class PSR area within a 2 km walking-EVA radius, mirroring NASA's
EVA-EXP-0070 Rev Dand the Lawrence 2025 FOM framework) and adds a per-launch-year HLS continuous-lit cross-check against Wueller's bundledSunDays25..32columns, headlining the 2028 Artemis IV target year. v2.1 swaps the singleicecriterion for a three-class multi-volatile criterion that distinguishes H₂O (<110 K), CO₂/NH₃ (<66 K), and ultra-cold (<60 K) thermal-class accessibility inside the same 2 km EVA disc, mirroring NASA's documented volatile-diversity priority (Paige 2010; Hayne 2020) and Wueller 2026's per-class treatment; the new criterion exposes per-class sub-scores so the catalog surfaces which sites access multiple volatile classes vs single. The release history below documents the engineering arc from v0.1 through v2.1.
![]()

NASA's Artemis IV mission will land humans near the lunar south pole in early 2028 (the program was restructured in February 2026, moving the first crewed landing from Artemis III to Artemis IV; the candidate landing regions identified in NASA's October 2024 down-selection are unchanged). Selecting a base site there is a multi-criteria optimisation problem: the south pole is a maze of crater rims that catch grazing sunlight, deep permanently-shadowed cold-traps that may host water ice, and active thrust faults that re-localised Apollo-era shallow moonquakes have placed within tens of kilometres of candidate sites. selene-base fuses the modern LRO-era remote-sensing record (LOLA topography, Diviner Polar Resource Product thermal and ice-stability data, Mazarico illumination maps, the Robbins crater catalog) with derived geometric criteria (Earth line-of-sight from horizon ray-marching, spatial coupling between PSRs and sunlit ridges) to score every 240 m pixel of the polar cap and rank top candidate sites. The pipeline is end-to-end reproducible — selene download && selene preprocess && selene score && selene rank-per-region && selene validate-per-region && selene viz produces the NASA-aligned per-region catalog, per-site HTML reports, and an interactive web map, on a developer laptop, in minutes, from public data.
56 of 69 selene-base candidate landing sites (81.2 %) match within 5 km of a peer-reviewed Wueller et al. 2026 site, with median match distance 1.69 km (v1.8, all eight criteria active; tightens from 1.76 km at v1.5). The 69 sites are the per-region HLS-compliant landing catalog at 20 m resolution: candidates across 8 of NASA's 9 Artemis IV candidate regions, all guaranteed inside their published USGS polygon and satisfying NASA's published HLS hard-constraint filters (slope ≤ 8°, 100 m buffer to steeper terrain, illumination ≥ 33 %, and DTE visibility ≥ 50 %) by construction. The sole region with zero compliant cells is Malapert Massif — a real terrain-driven finding that persists at 20 m, confirming the v1.4.2 result was not a 240 m sampling artefact (no cell inside the Malapert polygon simultaneously satisfies all four HLS thresholds at either resolution). The best-scoring region is Mons Mouton Plateau at score 0.732 with the largest HLS-eligible area (171.95 km², 3.86 % of polygon); the most constrained region with sites is de Gerlache Rim 2, where only 0.01 % of polygon cells pass the HLS filters at 20 m and only 2 sites fit at the 2 km NMS separation — also unchanged from 240 m, confirming the dGR2 disagreement with Wueller's catalog is genuine terrain divergence rather than a resolution artefact.
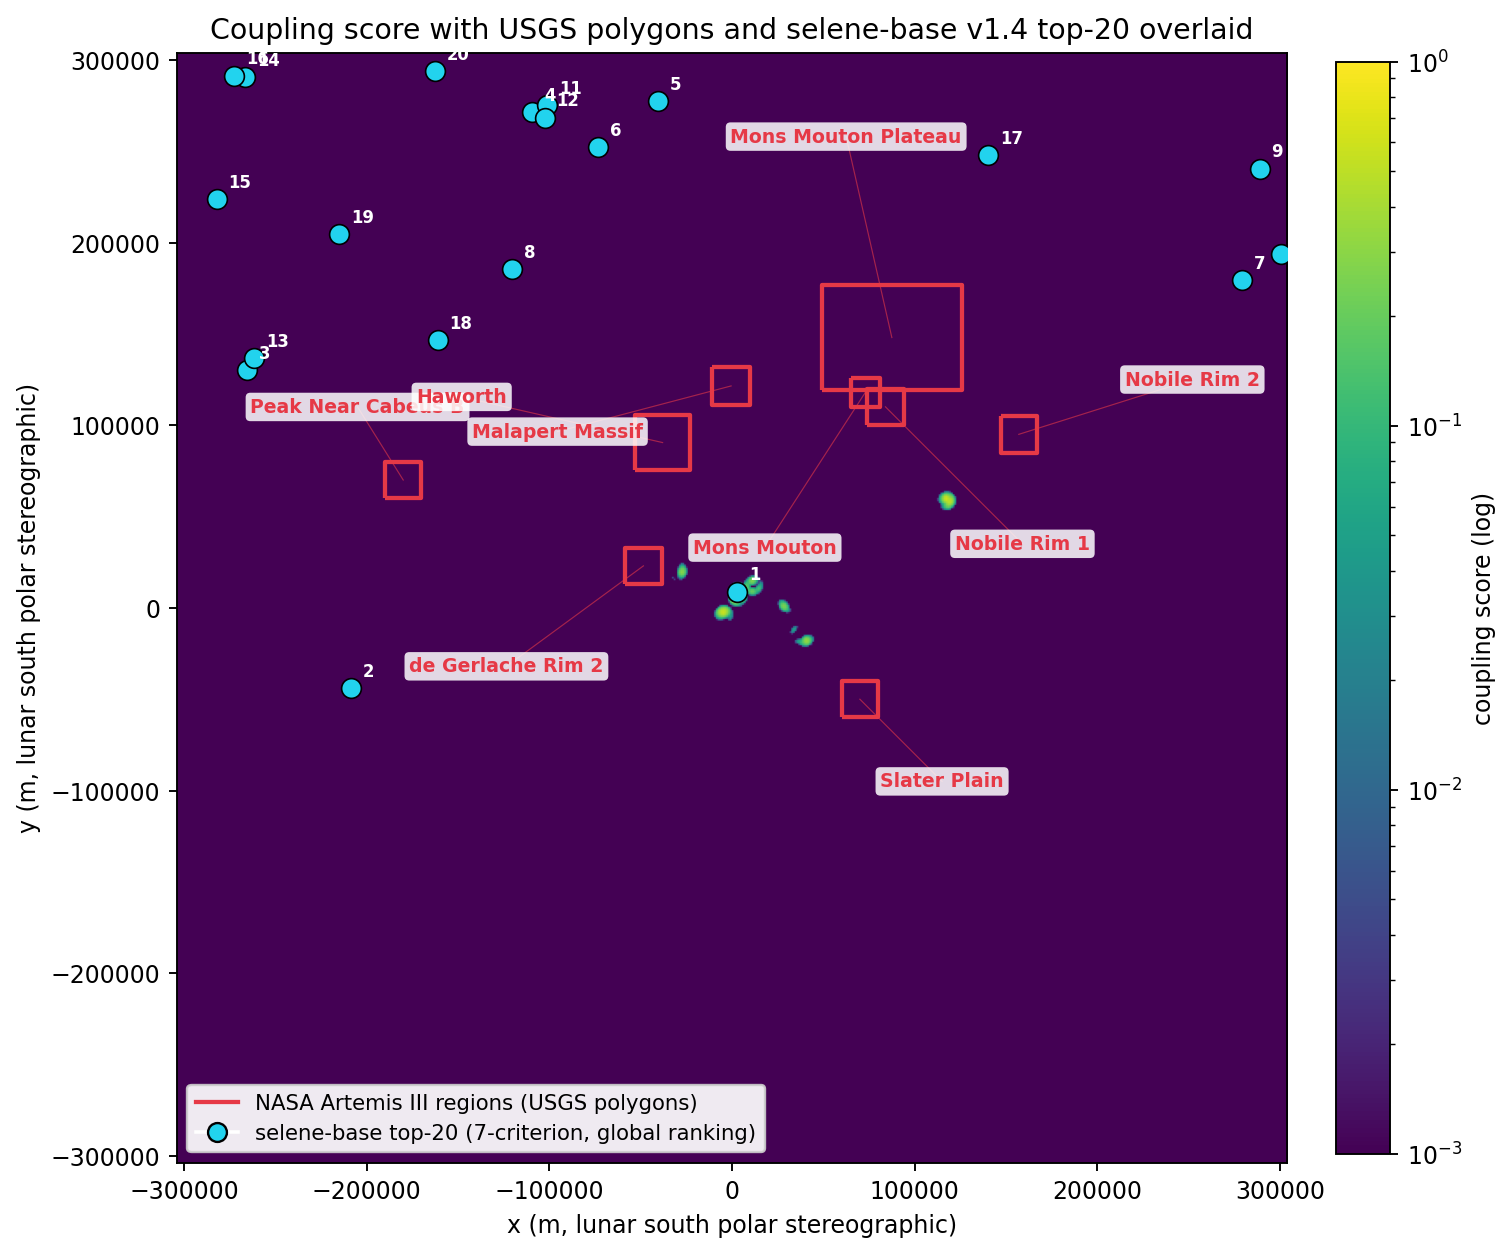
This headline is a reframing, not a refinement. The previous versions (v1.0.0–v1.2.0) measured a different question — global ranking of habitat suitability followed by validation against NASA polygons — and reported 0/20 because globally-selected top sites pick the polar rim band where the coupling criterion is non-zero rather than the interior of NASA-published regions. The Wueller et al. 2026 (JGR Planets, doi:10.1029/2025JE009434) parallel — which found 130 candidate sites with similar within-region HLS-filtered methodology — confirms that per-region HLS-filtered ranking is the right framing for a NASA-aligned site catalog.
The earlier releases (v1.0.0–v1.2.0) are preserved as the project's diagnostic history — they document why the global-ranking framing produced 0 inside-polygon results before the v1.3 reframing. The summary below tracks the releases in order; the v1.3 reframing supersedes the global-ranking interpretation but does not invalidate the diagnostic findings.
Across the v1.0.0 — v1.2.0 releases — through five revisions of the model and validation reference against NASA's nine announced Artemis III candidate regions — the global-ranking inside-polygon count was 0 / 20:
-
Adding well-validated criteria can degrade alignment. Integrating Diviner PRP thermal and ice criteria — both showing strong individual agreement with NASA centroids — worsened median distance from 65 km to 102 km. Weighted-sum MCDA cannot model NASA's coupled spatial constraint (near a PSR and near a sunlit ridge); it lets a high score on one axis compensate for a near-zero on another, producing top sites that maximize independent criteria but rarely satisfy the conjunction.
-
A spatial-coupling criterion is the structural fix. Modeling the conjunction directly (the multiplicative product of two distance falloffs, encoding the AND that linear-sum cannot) lifted the 200-sample sensitivity ceiling from 2/9 to 3/9 NASA regions matched, improved closest-distance from 64.8 km to 47.8 km, and the best-found weight regime now uses coupling at 0.27 weight rather than ignoring it.
-
A polygon-based validation metric and a thermal-target correction (v1.0.0) tightened the methodology, not the headline. Replacing the centroid-distance proxy with an "inside any 15 km disk" check and correcting the thermal-criterion target from the data-out-of-support 230 K to the data-median 140 K both produced informational shifts: the inside-any-disk count is also 0/20, but the closest-edge distance is now 32.8 km (about disk-radius below the centroid distance, exactly as the geometry predicts); the corrected thermal moved out of the Gaussian's tail (NASA centroids 0.113 → 0.526; our top-20 0.325 → 0.965), and 11/200 sensitivity samples now reach 3/9 region matches (was 1/200). Two methodological loose ends closed; the headline didn't move because the rim band our model identifies is geometrically distinct from NASA's centroid disks at any reasonable proximity threshold.
-
An Earth line-of-sight criterion (v1.1.0) narrows the gap without closing it. Adding the most physically prominent missing criterion — a per-pixel Earth-visibility fraction derived from a 36-azimuth horizon ray-march on the LOLA elevation grid plus libration-cycle sampling of the sub-Earth point — shifted the closest-distance from 47.8 km to 27.3 km (centroid) and from 32.8 km to 12.3 km (disk edge), put 1/9 NASA regions within one disk radius of a top site for the first time (Cabeus B), lifted the sensitivity ceiling from 3/9 to 4/9 regions matched, and produced the first non-zero polygon-inside count in any sensitivity run (21/200 samples now show ≥1 site inside a NASA disk) — though the default-weights polygon-inside count is still 0/20. The geometric gap is no longer absolute; it is, however, still robust under the operations-driven defaults.
-
Replacing the 15 km disk approximations with USGS's authoritative published polygons (v1.2.0) confirms the geometric separation is not a disk-approximation artefact. USGS Data Release 10.5066/P1MEQ6UK ships simplified envelopes (4-vertex quadrilaterals) for all nine Artemis III regions, derived from NASA's LROC QuickMap definitions. They differ substantively from the disk approximations: most regions are ~400 km² quadrilaterals (vs the disk's 707 km²); Mons Mouton Plateau alone is 4,452 km² — over 6× larger than the disk; one region the legacy code called "Cabeus B" is published as "Peak Near Cabeus B" centred on the rim, not the crater floor; and one disk centroid (the legacy "Slater Plain" at lon -54.3°) sits ~180° away from where USGS publishes Slater Plain (lon +125°). Against these authoritative polygons, the default-weights result is 0/20 top sites inside any USGS polygon, 0/9 USGS regions containing a top site, median distance to the nearest USGS polygon 135.1 km, closest 41.5 km (de Gerlache Rim 2). The 200-sample sensitivity sweep produces ≥1 site inside a USGS polygon in 6 / 200 samples (max 2/20). The geometric separation is real even against the right validation reference — the disk approximations were systematically misrepresenting the regions, but the model's rim-band optimum is still geometrically distinct from NASA's authoritative regions.
-
The right framing — per-region ranking with HLS hard filters (v1.3.0) — produces a per-region landing-site catalog across 8/9 NASA regions (23 sites at the v1.3 default of 3 per region, 70 sites at the v1.4.2 default of 10 per region). The first five stages of the arc all rank globally and ask "did our top-20 fall inside NASA's regions?" The right question, mirroring NASA's own selection process, is "within each NASA region, which cells satisfy the HLS landing requirements and rank highest by suitability?" Reframing the search this way produces a complete per-region landing-site catalog. The 0/20 result through v1.2.0 reflected the global-ranking framing, not a flaw in the model: globally-best cells cluster on the polar rim band where the coupling criterion is non-zero; per-region-best HLS-compliant cells cluster inside NASA polygons by construction. Both findings are valid — the diagnostic arc is preserved below for context.
The combined picture: the criteria are tuned, the validation primitive is authoritative, and the framing is now NASA-aligned. The previously-open scientific question — "do the v1.3 sites identify the same cells NASA's process identifies?" — is now answered quantitatively in v1.4.2 against Wueller et al. 2026's 130 published sites: 56/70 selene sites (80 %) match within 5 km of an in-scope Wueller site; median match distance 1.88 km (see "Quantitative comparison against Wueller et al. 2026" below).
The table below tracks the global-ranking inside-polygon count across the v1.0.0–v1.2.0 releases. v1.3.0 reframes the analysis to per-region ranking; the global-ranking inside-polygon count remains 0/20 by construction of the global framing, but is no longer the project's headline.
| Validation metric | v0.5 baseline | v0.6 (+PRP) | v0.7 (+coupling) | v1.0 (+poly) | v1.1 (+LOS) | v1.2 (USGS) |
|---|---|---|---|---|---|---|
| top sites within 25 km of any centroid | 0 / 20 | 0 / 20 | 0 / 20 | 0 / 20 | 0 / 20 | 0 / 20 |
| top sites inside any 15 km disk | n/a | n/a | n/a | 0 / 20 | 0 / 20 | 0 / 20 |
| top sites inside any USGS polygon | n/a | n/a | n/a | n/a | n/a | 0 / 20 |
| USGS regions containing a top site | n/a | n/a | n/a | n/a | n/a | 0 / 9 |
| closest USGS polygon (km) | n/a | n/a | n/a | n/a | n/a | 41.5 |
| median distance to nearest USGS polygon (km) | n/a | n/a | n/a | n/a | n/a | 135.1 |
| regions with a top site within 1 disk radius of edge | n/a | n/a | n/a | 0 / 9 | 1 / 9 | 1 / 9 |
| closest NASA region (centroid) | 25.8 km | 64.8 km | 47.8 km | 47.8 km | 27.3 km | 27.3 km |
| closest NASA region (disk edge) | n/a | n/a | n/a | 32.8 km | 12.3 km | 12.3 km |
| 200-sample sensitivity, best regions matched (centroid≤25 km) | 2 / 9 | 2 / 9 | 3 / 9 (1 sample) | 3 / 9 (11 samples) | 4 / 9 (5 samples) | 4 / 9 (5 samples) |
| 200-sample sensitivity, modal outcome | 0/9 (71.5 %) | 0/9 (92.5 %) | 0/9 (87 %) | 0/9 (86.5 %) | 0/9 (78.5 %) | 0/9 (78.5 %) |
| 200-sample sensitivity, samples with ≥1 site inside any disk | n/a | n/a | n/a | 0 / 200 | 21 / 200 | 21 / 200 |
| 200-sample sensitivity, samples with ≥1 site inside any USGS polygon | n/a | n/a | n/a | n/a | n/a | 6 / 200 |
| coupling score at our top-20 vs NASA centroids | n/a | n/a | 0.053 vs 0.000 | 0.025 vs 0.000 | 0.025 vs 0.000 | 0.025 vs 0.000 |
| thermal score at our top-20 vs NASA centroids | n/a | 0.239 vs 0.113 (in tail) | 0.325 vs 0.113 (in tail) | 0.965 vs 0.526 | 0.962 vs 0.526 | 0.962 vs 0.526 |
| LOS-to-Earth score at our top-20 vs NASA centroids | n/a | n/a | n/a | n/a | 1.000 vs 0.525 (bimodal) | 1.000 vs 0.525 |
The default-weights inside-region number is 0 across every release in the table, against every validation primitive tried. What moved is the structure behind that number — the sensitivity ceiling lifted twice (2 → 3 → 4 regions), the closest-edge metric collapsed (47.8 → 12.3 km against disks; the v1.2 USGS polygons reset the closest-distance to 41.5 km because USGS's "Slater Plain" sits 180° away in longitude from where the legacy disk centroid placed it), the polygon-inside count became sample-non-zero against disks (21/200 weight regimes hit 1/20 or more), and one NASA region (Cabeus B) came within disk-radius of a top site. v1.2.0 against the authoritative USGS polygons confirms the geometric separation is not a disk-approximation artefact: even with the right validation reference, only 6/200 weight regimes produce ≥1 site inside any USGS polygon, and the default-weights answer is 0/20. Under the global-ranking framing, the model picks the polar rim band where the coupling criterion is non-zero; NASA's published landing-region polygons sit 41–135 km away from that band; no setting of physics-driven defaults collapses those two geometries onto each other. v1.3.0 reframes the analysis to per-region ranking and resolves this — see "Per-region HLS-compliant catalog" below.
For the per-region distance table see data/outputs/validation.json (now contains both centroid-distance and polygon-inside metrics), or run selene validate on a fresh checkout. The interactive map lives at data/outputs/webmap.html after selene viz; per-site reports under data/outputs/sites/.
data/raw/<dataset>/        --load-->  xr.DataArray (native CRS)
                              |
                              v reproject_to_grid(target_crs, bounds, 240 m)
                              |
data/processed/<name>_southpole_240m.tif        (cached COG)
                              |
                              v criterion.compute(...)            [eight criteria]
                              |
data/processed/scored/<name>_score_southpole_240m.tif
                              |
                              v scoring.aggregate.weighted_sum()  [renormalises]
                              |
data/outputs/score_southpole.tif                (final aggregate COG)
                              |
                              +--> scoring.ranking.top_n_sites_per_region()  [v1.3 primary]
                              |    + HLS hard filters per USGS polygon
                              |    -> data/outputs/per_region/sites.{geojson,csv}
                              |
                              +--> scoring.ranking.top_n_sites()             [legacy global]
                              |    -> data/outputs/top_sites.{geojson,csv}
                              |
                              v validation.comparison + viz
                              |
data/outputs/validation.json + webmap.html + sites/
git clone https://github.com/Alex0420W/selene-base.git
cd selene-base
python -m venv .venv && source .venv/bin/activate    # Windows: .venv\Scripts\activate
pip install -e .

# Five-line clone-to-webmap path on the bundled ~12 MB sample dataset
# (a single LOLA tile, the south-pole subset of the Mazarico illumination
# raster, and a 1000-row crater catalog excerpt — enough to exercise the
# full preprocess -> score -> rank pipeline end-to-end):
selene download --sample        # downloads + extracts data/raw/<sample>
selene preprocess               # warps + crater-density rasterisation -> data/processed/
selene score                    # seven criteria; missing ones renormalise out cleanly
selene rank-per-region          # NASA-aligned per-USGS-polygon catalog (default n_per_region=10)
selene viz                      # webmap.html + per-site HTML reports
                                # (note: webmap loads Leaflet from a CDN on
                                #  first open; everything else is offline-safe)

# Diagnostic & robustness (legacy global-ranking framing):
selene rank --top-n 20          # global NMS top-N
selene validate                 # alignment metrics vs NASA's nine candidates
selene validate-per-region      # per-region summary: n sites, eligible-area %, best score
selene compare                  # per-criterion delta our top-20 vs NASA centroids
selene sensitivity --n-samples 200       # 200-sample weight-vector simplex sweep
selene coupling-sweep                    # tune coupling_distance_km against alignment
selene compare-wueller          # quantitative comparison vs Wueller 2026 (130 real sites, CC-BY 4.0)

# Full-resolution analysis (~900 MB raw, 4 verified URLs):
selene download robbins         # ~92 MB
selene download lola            # ~115 MB
selene download illumination    # ~82 MB
selene download diviner         # ~605 MB Diviner Polar Resource Product (PRP)
# selene download lend remains TODO-flagged (no verified URL); the seismic-
# criterion scarp catalog (Mishra & Kumar 2022) ships bundled in-repo as of
# v1.8 — no separate download step needed.
selene preprocess && selene score && selene rank-per-region

# v1.5+ tiled mode at 20 m (CUDA GPU + ~140 GB unified memory, see "Resolution analysis"):
selene preprocess --tiled-per-region --resolution 20
selene rank-per-region --tiled-per-region --resolution 20

# Tiled mode against a non-PDS LOLA source (PGDA mosaic, NAC stereo DEM, custom DEM)
# bypasses the auto-detect priority list (v1.8.3+); at 10 m the driver
# auto-enables per-azimuth chunking + mmap accumulator (v1.9+) so the
# 70 GB-per-tile output array fits in GB10's 119 GB unified memory:
selene preprocess --tiled-per-region --resolution 10 \
                  --lola-source data/raw/lola/ldem_83s_10mpp_adj.tif
selene --help lists every subcommand; selene <cmd> --help shows its options.
Every criterion produces a [0, 1] score grid where 1 is "best" and 0 is "unusable", aligned to the common 240 m south-polar stereographic grid (+proj=stere +lat_0=-90 +lat_ts=-90 +R=1737400, ±304 km, defined in config/region_southpole.yaml). Three normalisation primitives in scoring/normalize.py — min_max, optimal_range (Gaussian), inverse_threshold — cover every criterion. The aggregate is a weighted linear sum that renormalises across whichever criteria are present at score-time, so a partial pipeline produces a comparable score to a complete one — only the absolute meaning of "0.97" shifts. As of v1.8 the methodology is fully realised with eight active criteria; v2.0 swaps the v1.x global spatial-coupling product for EVA-disc PSR access at the same weight slot; v2.1 swaps the single ice criterion for the three-class multi-volatile criterion (H₂O <110 K, CO₂/NH₃ <66 K, ultra-cold <60 K) inside the same 2 km EVA disc — also at the same weight slot. The active set is now (slope, illumination, hazard, thermal, multi_volatile, eva_psr_access, los_to_earth, seismic) — eight criteria contributing to the aggregate score by default.
| Criterion | Score function | Source dataset | Resolution | Resampling | Default knobs |
|---|---|---|---|---|---|
| Slope | LOLA LDEM 80 m (PDS3) | 80 m -> 240 m | bilinear | ||
| Illumination | Mazarico avgvisib 65°S 240 m | 240 m | bilinear | ||
| Thermal |
|
Diviner PRP temp_avg (PDS4) |
triangle mesh -> 240 m | linear griddata | $T^\star=140,$K, $\sigma=30,$K (v1.0.0 correction; was 230 / 50, outside data support) |
| Multi-volatile (v2.1; replaces Ice) | $s = \frac{1}{3}(s_{\text{H}2\text{O}} + s{\text{CO}2/\text{NH}3} + s{\text{ultra}})$ where each $s{\text{class}}$ = fraction of 2 km EVA-disc cells with temp_max < T_{\text{class}}
|
Diviner PRP temp_max (PDS4) |
240 m | circular-kernel convolution | $r_{\text{EVA}} = 2,$km; $T_{\text{H}2\text{O}} < 110,$K, $T{\text{CO}_2/\text{NH}3} < 66,$K, $T{\text{ultra}} < 60,$K |
| Hazard | Robbins 2019 catalog | vector -> 240 m density | KDTree, 3 km radius | ||
| EVA-disc PSR access (v2.0; replaces Coupling) | $s = $ cold-class cells / total cells inside 2 km disc, where cold-class is temp_max < 110 K
|
Diviner PRP temp_max (PDS4) |
240 m | circular-kernel convolution | $r_{\text{EVA}} = 2,$km, $T_{\text{cold}} < 110,$K |
| LOS-to-Earth | linear ramp on per-pixel Earth visibility fraction over libration | derived: LOLA elevation (horizon profile) | 240 m | bilinear ray sampling | $\text{vis}{\min}=0.20,,\text{vis}{\text{target}}=0.50$ |
| Seismic (v1.8) |
|
Mishra & Kumar 2022 (bundled, primary) + Watters 2015 polar (bundled, attribution anchor) | vector -> 240 m distance | KDTree, 1 km densified vertices | $d_0 = 25,$km, $k = 8,$km |
Slope is computed at the 240 m target resolution from the already-downsampled LOLA DEM via numpy.gradient with explicit metric spacing (Zevenbergen & Thorne 1987 convention; ~5 % off Horn 1981 on smooth surfaces). Computing slope on the high-res 80 m DEM and then averaging slope-degrees double-smooths and biases low; computing on the target-resolution DEM keeps everything self-consistent.
The thermal and ice criteria are both fed by the Diviner Polar Resource Product (dlre_prp_south.tab) — a single PDS4 character table of 2.88 M triangular-mesh facets, ~605 MB raw. data/pds4_table.py parses it via the matching XML label; data/triangle_to_grid.py interpolates each scalar field onto the project's 240 m polar stereographic grid using scipy.interpolate.griddata (linear for temperatures, nearest for the discontinuous ice-depth field). Outputs are cached as three GeoTIFFs in data/processed/ so the slow ~30 s parse step happens once.
The PSR mask used by the ice criterion is still derived from the Mazarico illumination raster (illumination < 0.001); the PRP is a thermal-stability calculation, not an ice-existence map, so PSR proximity adds an orthogonal signal.
Default weights from config/weights_default.yaml (v2.1 — multi-volatile criterion replaces ice at the same 0.17 weight slot): illumination 0.17, multi_volatile 0.17, eva_psr_access 0.17, los_to_earth 0.14, slope 0.12, thermal 0.07, hazard 0.06, seismic 0.10. Both v2.0 (coupling → eva_psr_access) and v2.1 (ice → multi_volatile) are methodology swaps, not re-weightings — both new criteria sit in the slot v1.x's coupling and ice originally held (0.17 each), so any catalog-level shift attributable to either swap reflects the new criterion's geometry, not a moved weight. Inside multi_volatile, the three sub-classes (H₂O, CO₂/NH₃, ultra-cold) are equally weighted by default (1/3 each) — agnostic on NASA's preference ordering between volatile classes; expose sub_weights= for downstream sensitivity. The 0.10 seismic weight reflects that scarp distance is one of multiple safety factors and is most relevant on long habitat-occupation timescales; the other seven weights are scaled by 0.928 from the v1.5 vector so the simplex sums to 1.00 without changing relative ratios. The 0.15 LOS weight (now 0.14 after seismic activation) was chosen before the v1.1.0 validation rerun on physics-and-operations grounds: LOS is a real physical criterion NASA prioritises in mission planning, but more binary-ish than continuous, so weighted slightly less than illumination/multi_volatile/eva_psr_access. Older weight vectors are preserved: config/weights_legacy.yaml (5-criterion baseline, no coupling/LOS), config/weights_legacy_v6.yaml (v1.0.0 6-criterion, no LOS); the v1.8 vector is the v2.1 vector with eva_psr_access renamed back to coupling and multi_volatile renamed back to ice.
NASA's Artemis site-selection process (Lawrence 2025, NTRS 20250008952) applies "weighted Figures of Merit" across multiple multi-directorate assessment categories. The specific FOM values are not publicly disclosed; what is documented is the conceptual framework. selene-base's seven physics-driven criteria can be mapped to NASA's FOM categories as follows:
| selene-base criterion | NASA FOM category | data source agreement | NASA values |
|---|---|---|---|
| Slope (≤ 8 °, 100 m buffer) | Site Availability + Deorbit/Descent/Landing | LOLA-derived (consistent) | published threshold (HLS) |
| Illumination | Mission Availability | Mazarico raster (consistent) | published threshold (HLS) |
| Thermal | Science Objectives | Diviner PRP (consistent) | not public |
| Multi-volatile (H₂O / CO₂-NH₃ / ultra-cold) (v2.1; replaces Ice) | Science Objectives + Volatile Diversity | Diviner PRP temp_max (consistent) |
volatile-class priority documented (Lawrence 2025 FOM); per-class weights not public |
| Hazard (crater density) | Site Availability | Robbins 2019 catalog (consistent) | not public |
| EVA-disc PSR access (v2.0; replaces Coupling) | Mission Availability + Science Objectives + Crew EVA | derived (Diviner PRP temp_max) |
EVA-EXP-0070 Rev D documents the 2 km walking-EVA radius |
| LOS-to-Earth | Mission Availability | derived (LOLA + libration) | published threshold (HLS) |
| Seismic (Watters scarps) | Site Availability | Mishra & Kumar 2022 + Watters 2015 (consistent; bundled in-repo since v1.8) | not public |
selene-base implements physics-driven analogs of NASA's FOM categories using public data and operations-driven thresholds, not direct implementations of NASA's actual weighting (which is not public). The HLS hard-constraint thresholds (slope, slope-buffer, illumination, DTE visibility) are published and are matched verbatim. The soft-criterion weights are physics-and-operations-driven defaults set before any validation rerun, not tuned to match a NASA reference. This positions selene-base honestly: a complete public-data implementation of the conceptual framework documented by Lawrence 2025, calibrated to physics-driven defaults rather than fitted to undisclosed NASA-internal weights.
Civilini et al. (2023) re-located several Apollo-era shallow moonquakes and showed several of them cluster within tens of kilometres of mapped lunar lobate scarps — the same fault-scarp landforms catalogued globally by Watters et al. (2015) and extended for the south polar region by Mishra & Kumar (2022). v1.8 activates the eighth criterion as distance-to-nearest-scarp, with a logistic mapping centred on Civilini's documented moonquake-to-scarp clustering distance:
- cells within 5 km of a mapped scarp score ~0.08 (high seismic risk),
- cells at 25 km score 0.50 (transition; matches typical Apollo-era epicentral-uncertainty scale),
- cells beyond 50 km score ~0.96 (effectively safe under the Civilini regime).
The default weight is 0.10 (slightly below slope, reflecting that scarp distance is one of multiple safety factors most relevant on long habitat-occupation timescales). The logistic shape is preferred over a hard linear ramp because Civilini's moonquake-to-scarp distance estimates are themselves probabilistic with epicentral uncertainty of order 10 km.
The primary data source is Mishra & Kumar (2022) (Geophysical Research Letters, doi:10.5281/zenodo.6624114, CC-BY 4.0): 704 south-polar lobate-scarp line segments combining Watters' published mapping with 75 new scarps from independent LROC NAC analysis. The 704 segments cover all 9 USGS Artemis IV candidate regions plus the 100 km horizon-march buffer. The original LROC SOC POLAR_SCARP_LOCATIONS shapefile (citing Watters et al. 2015 verbatim, NASA-hosted) is bundled alongside as an attribution anchor and sanity reference at src/selene_base/criteria/data/scarps_watters_2015_polar/.
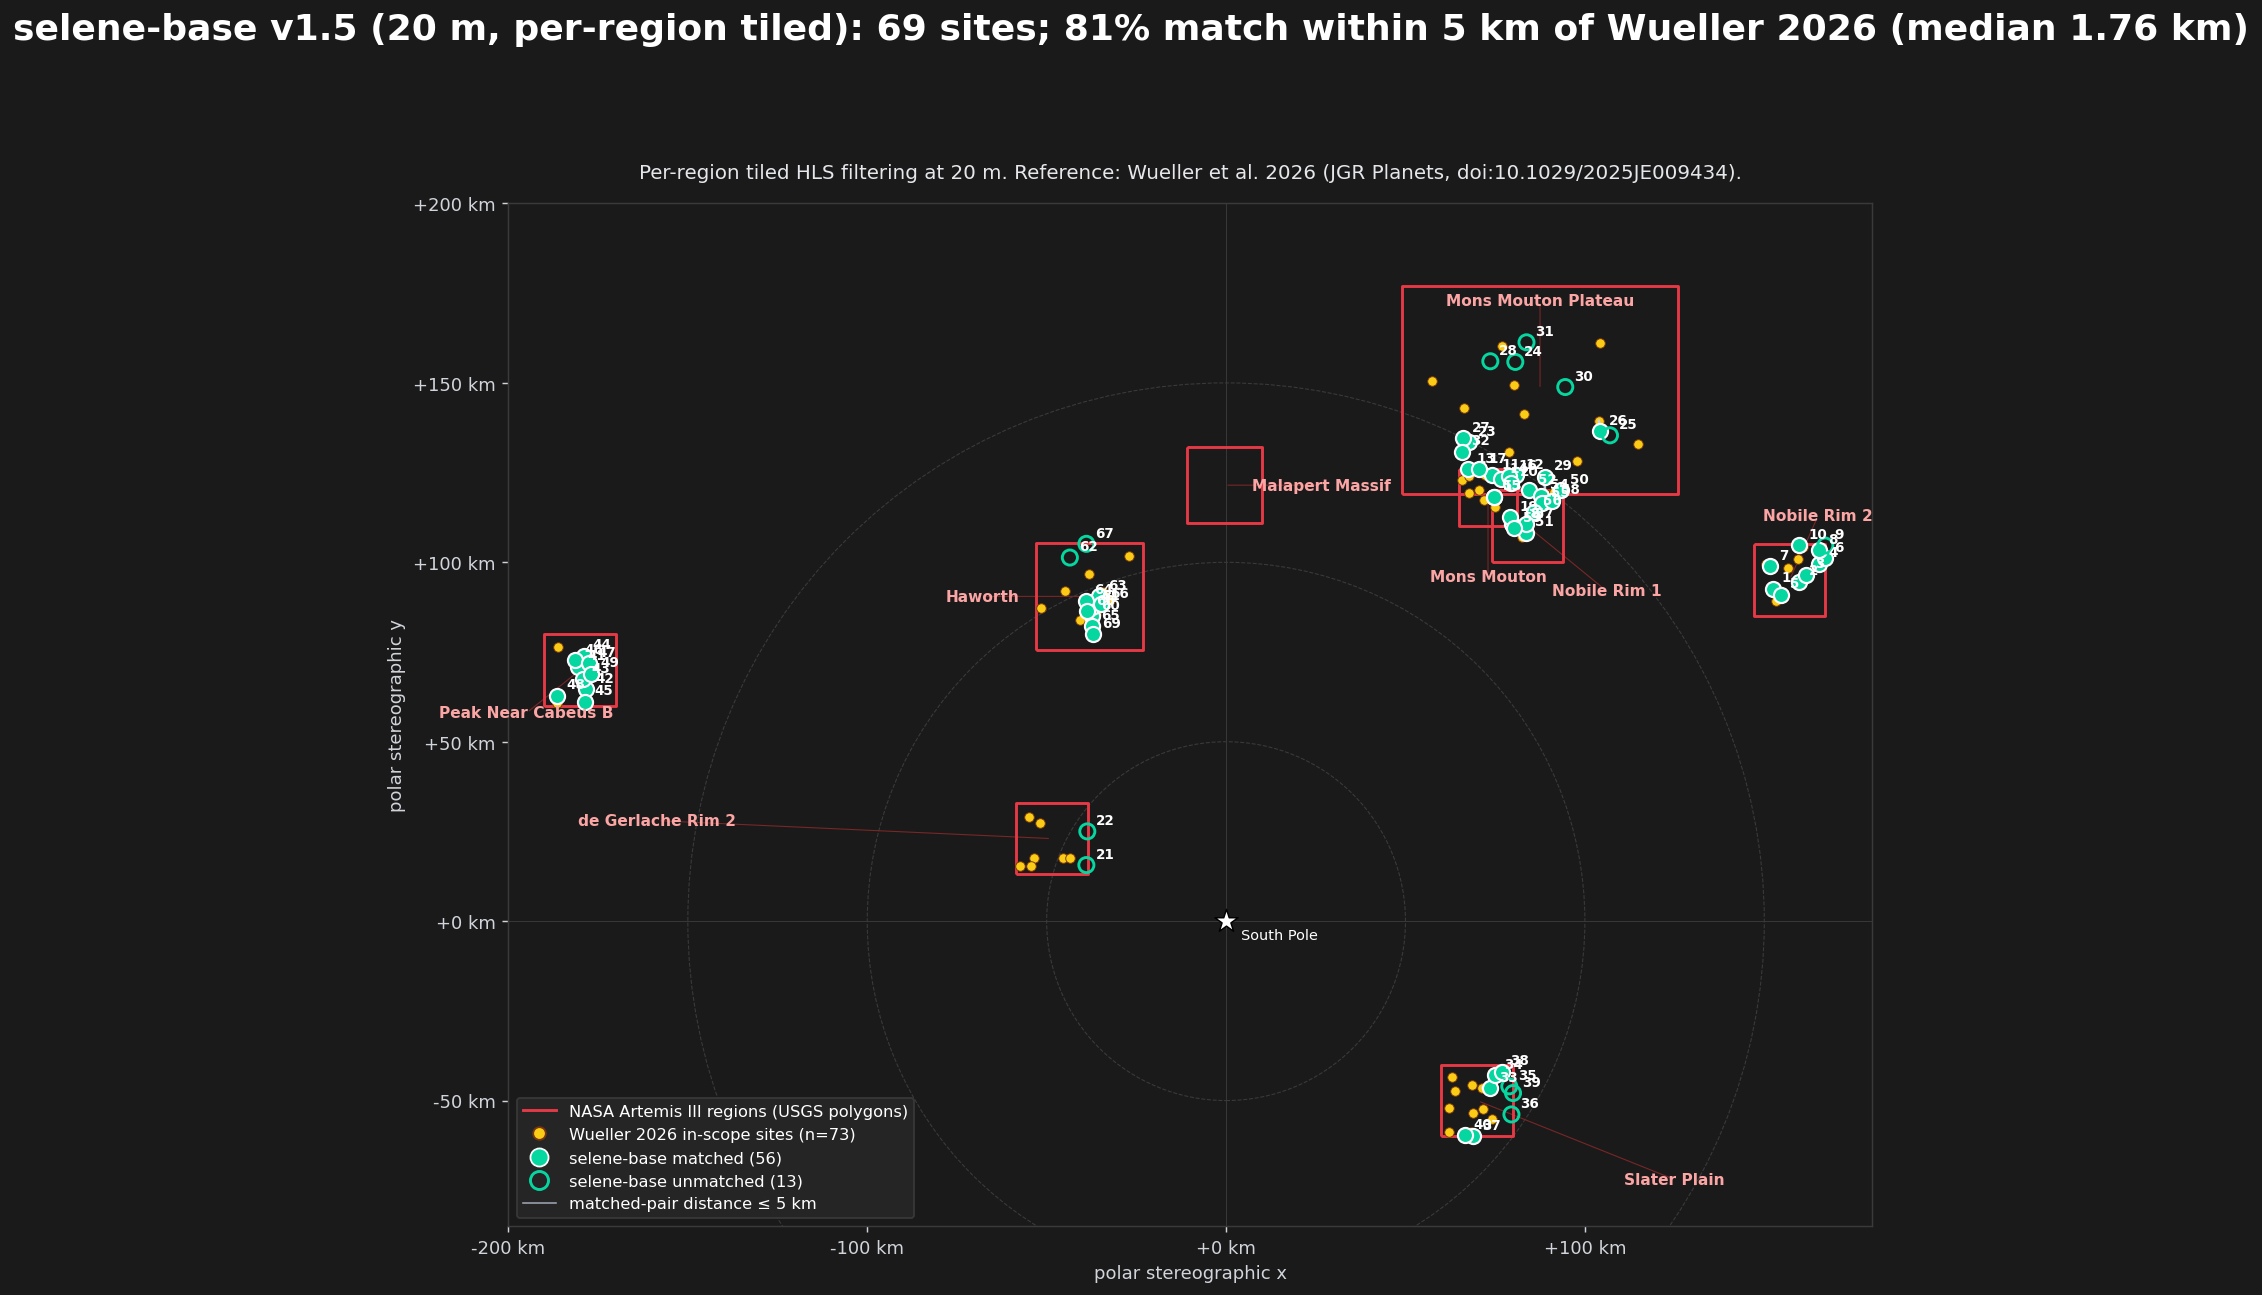
Result against Wueller 2026 with all eight criteria active (20 m per-region tiled run on the v1.5-cached preprocessing): 56 / 69 selene sites (81.2 %) match within 5 km of an in-scope Wueller site (identical to v1.5's 7-criterion result); 46 / 73 (63.0 %) of in-scope Wueller sites match a selene site within 5 km (up from 44 / 73 in v1.5, +2.7 pp); median matched-pair distance 1.69 km vs 1.76 km in v1.5 (-0.07 km, tightens). Same 69-site catalog by site count and same top-3 sites in every region; 13 sites in HW/MMP/N1/N2 reshuffle ranks 4–10 within their polygons because the seismic component lifts the aggregate of slightly-further-from-scarp cells just enough to flip a few interior orderings.
The default aggregator (v1.4+) is a weighted linear sum:
scoring/aggregate.weighted_sum).
The linear sum is simple, matches Wueller et al. 2026's framework,
and is indifferent to balance: a cell that saturates one criterion
at 1.0 and zeroes another scores the same as a cell that scores 0.5
on both, given equal weights.
v1.7 adds scoring/aggregate.topsis
as an alternative aggregator. TOPSIS (Hwang & Yoon 1981) vector-
normalises each criterion to L2 unit length, applies the weights,
identifies the per-criterion ideal (max) and anti-ideal (min) of the
weighted-normalised grid, and scores each cell by closeness:
Result on the v1.5 20 m catalog (same HLS filters, same per-region NMS, only the aggregator changes):
| metric | v1.5 (weighted_sum) | v1.7 (TOPSIS) | Δ |
|---|---|---|---|
| selene sites | 69 | 69 | 0 (HLS filters unchanged) |
| selene matched within 5 km of Wueller in-scope | 56 / 69 (81.2 %) | 55 / 69 (79.7 %) | -1 site, -1.5 pp |
| Wueller matched within 5 km of selene | 44 / 73 (60.3 %) | 44 / 73 (60.3 %) | 0 |
| median matched-pair distance | 1.76 km | 1.84 km | +0.08 km |
| max matched-pair distance | 4.81 km | 4.59 km | -0.22 km |
| top-5-by-score sites | 23, 24, 25, 26, 27 (Mons Mouton Plateau) | 23, 24, 25, 26, 27 (Mons Mouton Plateau) | identical |
Per-region median pair distance:
| region | weighted_sum (v1.5) | TOPSIS (v1.7) | Δ |
|---|---|---|---|
| Haworth | 1.77 km | 1.26 km | -0.51 km (tightens) |
| Mons Mouton | 1.90 km | 1.95 km | +0.05 km |
| Mons Mouton Plateau | 2.03 km | 1.63 km | -0.40 km (tightens) |
| Nobile Rim 1 | 1.32 km | 0.88 km | -0.43 km (tightens) |
| Nobile Rim 2 | 1.13 km | 1.30 km | +0.17 km |
| Peak Near Cabeus B | 2.04 km | 2.04 km | 0 |
| Slater Plain | 2.03 km | 2.01 km | -0.02 km |
| de Gerlache Rim 2 | — (0/2) | — (0/2) | — |
Headline reading: TOPSIS produces an identical site catalog (same 69 cells, same top-5) but a different per-region distance distribution. Three of seven regions with matched pairs tighten meaningfully (HW, MMP, N1, all by -0.40 to -0.51 km); two widen slightly (MM, N2, both ≤ +0.17 km). The headline 81.2 % → 79.7 % match rate change is one site flipping just past the 5 km threshold; max-pair distance improves under TOPSIS. Both aggregators agree on which cells are top-tier; they disagree at the margin where 1.5–4 km matter.
Run TOPSIS via --method topsis on selene score and selene rank-per-region:
selene score --method topsis --outputs-dir data/outputs/topsis
selene rank-per-region --method topsis --tiled-per-region --resolution 20
selene compare-wueller --sites data/outputs/topsis/per_region_tiled_topsis/sites.geojson \
    --outputs-dir data/outputs/topsis/v17
Outputs land under data/outputs/topsis/ so the TOPSIS catalog sits side-by-side with the weighted-sum default at data/outputs/per_region_tiled/ without clobbering it. Default stays weighted_sum for backward compatibility — v1.5's headline number is unchanged.
Through v1.2.0, the pipeline ran global ranking: the aggregate score grid is NMS-extracted across the entire ±304 km polar grid, producing a top-20 list that may or may not fall inside NASA polygons. Validation then asked "did our top-20 hit the polygons?" — and reported 0/20 across every revision through v1.2.0.
v1.3.0 reframes the analysis to match NASA's actual selection process. selene rank-per-region searches within each USGS polygon, applying NASA's published Human Landing System (HLS) hard-constraint filters as a precondition before ranking by suitability score. The result is a per-region landing-site catalog: every site is inside its named polygon by construction; every site satisfies the published HLS thresholds; the soft-criterion aggregate score is used only to rank within the surviving HLS-compliant cell set.
This mirrors the methodology in Wueller et al. 2026 (JGR Planets, doi:10.1029/2025JE009434), which catalogued 130 candidate Artemis-III sites with the same per-region + HLS-filter approach. The two approaches use different soft-criterion stacks but the same outer framing.
The legacy selene rank command is preserved for continuity with the v1.0.0–v1.2.0 release history; both ship in v1.3.0+. Per-region ranking is the primary path.
The four NASA HLS thresholds applied as a multiplicative AND inside each USGS polygon:
| Filter | Threshold | Source data |
|---|---|---|
| Slope at the landing pad | LOLA-derived slope grid | |
| Distance to nearest cell with slope |
$\ge 100,$m | Slope grid + scipy.ndimage.distance_transform_edt
|
| Direct solar illumination | Mazarico average-illumination raster | |
| Direct-to-Earth (DTE) visibility over the libration cycle | The v1.1.0 LOS-to-Earth visibility raster |
These thresholds are NASA-published values. Sources:
- NASA HLS specification (NASA 2019).
- Gracy & Lee 2024, Update on the Artemis III Reference Mission, LPSC Abstract #1695.
- Wueller, F., et al. 2026, JGR Planets, doi:10.1029/2025JE009434.
They are not tuneable from the validation result; the ranker accepts them as input parameters but the defaults reflect the published NASA values verbatim. A site that fails any one of the four filters is disqualified regardless of how well it scores on the soft criteria.
The 100 m buffer is computed globally on the slope grid (the distance from a cell to the nearest cell with slope n_per_region sites are NMS-extracted at a default 2 km separation.
criteria/coupling.py is the structural fix the v0.6 diagnostic identified. It scores cells by joint proximity to two distinct features:
- Distance to the nearest PSR: derived from the Mazarico illumination raster as
illumination < 0.001, thenscipy.ndimage.distance_transform_edtwith explicit pixel sampling. - Distance to the nearest sunlit ridge: a cell qualifies if
illumination >= 0.70AND5° <= slope <= 25°— the geometry of polar crater rims (steeper than plains, not cliff-like, well-sunlit). Same distance transform.
The score is the product of two linear distance falloffs:
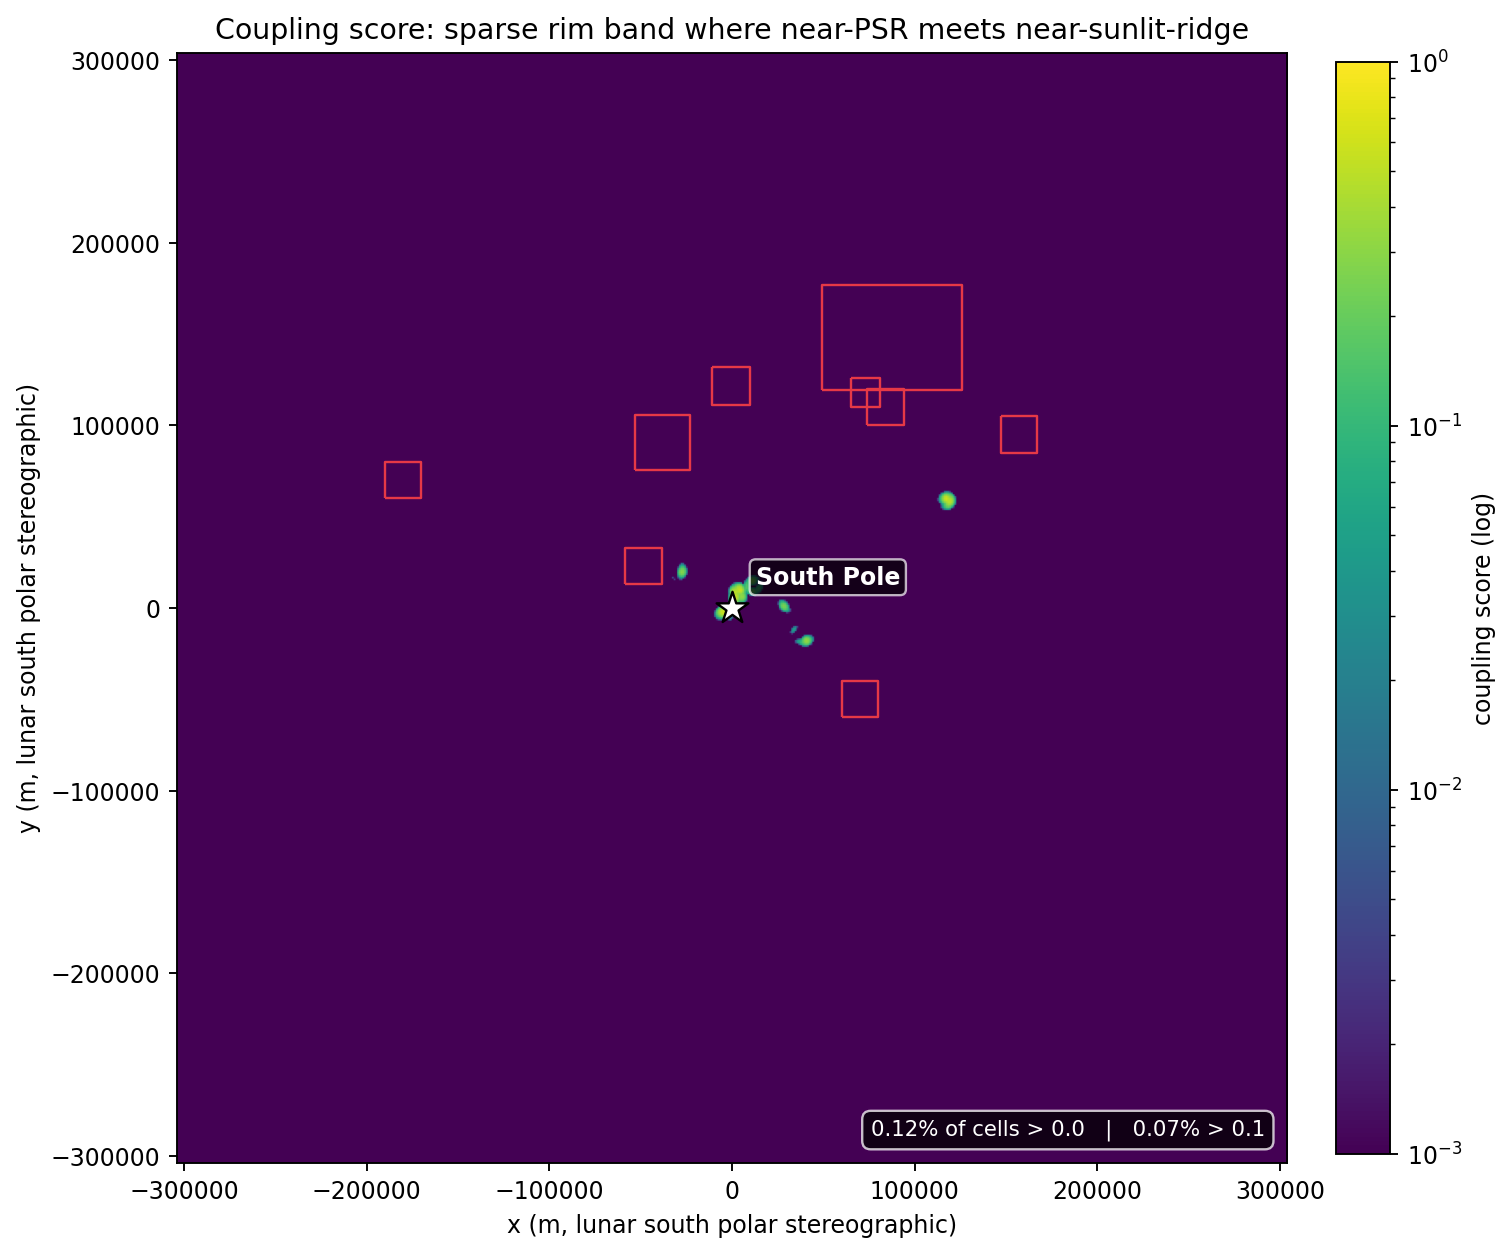
The product (not sum) is the conjunction. Failing either falloff drives the score to zero — exactly the structural property a linear weighted sum cannot encode. A cell deep inside a far-side PSR (PSR distance 0, ridge distance 200 km) scores 0; a cell on a sunlit rim 30 km from the nearest PSR also scores 0; the rim cell adjacent to a PSR-floor (both distances < 5 km) scores high.
The criterion produces a sparse mask: only 0.12 % of finite cells exceed 0.0; only 0.07 % exceed 0.1. The polar rim band shows up clearly; the rest of the cap is essentially black:
The single tuning knob is coupling_distance_km. selene coupling-sweep runs the validation pipeline at 1–20 km in 8 steps and plots NASA-region alignment as a function of that knob:
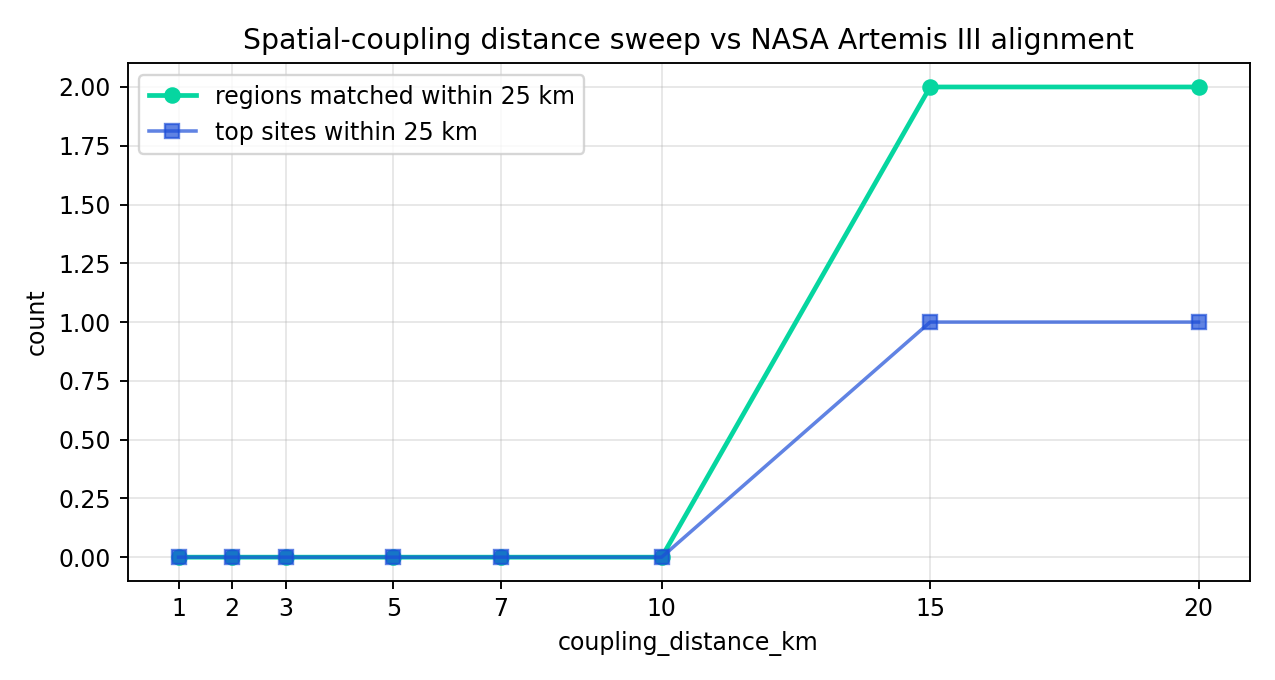
| coupling_distance_km | regions matched within 25 km |
|---|---|
| 1 – 10 | 0 / 9 |
| 15 – 20 | 2 / 9 |
The curve is monotone-but-flat: tightening the cap below 10 km matches no NASA regions; loosening it to 15 km picks up the Slater Plain / de Gerlache Rim 2 pair (the two NASA candidates already nearest the high-coupling band) and stays at 2/9 through 20 km. The 15 km threshold equals the validation disk radius — that's the geometric fingerprint of the validation-metric finding: the criterion can only "match" a NASA region when the matching tolerance equals the disk approximation, because the sites it picks fall on the rim band, not inside the centroid disks. The default 5 km is kept; the criterion is doing what its math says.
criteria/los_to_earth.py is the seventh criterion, derived from the already-cached LOLA elevation grid in two passes:
-
derive_horizon_profileray-marches outward from each pixel in 36 azimuthal directions (10° resolution) up to 100 km, tracking the maximum elevation angle of obstructing terrain (with curvature correction for the lunar sphere of $R = 1737.4,$km). Sampling is log-spaced (50 distances from 240 m to 100 km) and the result is a 3D(azimuth, y, x)field cached as a compressed numpy archive (lola_horizon_profile_southpole_240m.npz, ~840 MB; netCDF would be more idiomatic but the only backend available without extra system deps doesn't support compression). One-time cost: ~6 minutes single-threaded on the full 2533×2533 grid. -
compute_earth_visibility_fractionsamples 24 parametric points on the libration ellipse (Earth's sub-Earth point cycles within$\pm 6.5°$ in latitude and$\pm 7.9°$ in longitude over ~27 days), computes Earth's apparent elevation and azimuth at every pixel for each sample, rotates the geographic azimuth into the grid frame using the local grid convergence$\gamma = \mathrm{atan2}(x_p, y_p)$ for south polar stereographic, and counts the fraction of samples for which Earth's elevation exceeds the horizon angle in the matching azimuth bucket. The result ships as a 2D COG (los_visibility_fraction_southpole_240m.tif).
The score is a linear ramp anchored to operational comms thresholds: visibility below min_visibility = 0.20 scores 0.0 (Apollo-era surface ops baselined >20% direct-comms duty cycle as a crew-safety floor); visibility at and above target_visibility = 0.50 scores 1.0 (sustained habitat with redundant relay backup); linear in between. These thresholds are physics-and-operations driven and were chosen before the validation rerun, so they are not validation chasing. The libration sampling at 24 parametric points is a coarse approximation of the Lissajous trajectory traced by physical (period 27.55 d) and optical (27.32 d) libration; documented as such in the function docstrings.
The geometric pattern in the visibility raster is the expected one: deep crater floors near the pole score near 0 (the rim blocks Earth at every libration phase); high ridge tops score near 1 (clear horizon); the geometric south pole pixel scores ~0.5 (Earth oscillates symmetrically above/below local horizontal as the libration cycle traces
A few choices in the pipeline are worth surfacing because they materially affect what runs, when, and how reliably:
- Verified URLs over guessed URLs. Every dataset's download path was manually verified by browsing the PDS Geosciences directory listing rather than synthesised from a documentation pattern. Two URLs (LEND, Watters scarps) remain TODO-flagged because no verified path exists, rather than silently 404'ing.
- PDS3 + PDS4 in the same loader namespace. LOLA is PDS3 (open via the detached
.lbllabel, GDAL's PDS driver requirement); Diviner PRP is PDS4 (parse.xmlschema, fixed-width ASCII table). Both feed the samexr.DataArrayinterface downstream so callers never see the format difference. - Triangle mesh → raster rasterisation. Diviner PRP's 2.88 M triangular-mesh facets are interpolated to the 240 m polar stereographic grid via
scipy.interpolate.griddata(linear for temperatures, nearest for the discontinuous ice-depth field) — not rasterised by polygon fill, which would be both slower and physically meaningless for sparse triangle centres. - Cloud-Optimized GeoTIFF caching with overviews. Every reprojected raster is written as a COG with internal tiling and DEFLATE compression, so re-running
selene scoreafter a fresh clone is essentially free. - Two independent sensitivity sweeps. Latin-hypercube weight-vector sweep (200 samples on the simplex) characterises robustness to weight choice; coupling-distance sweep (8 points across 1–20 km) characterises robustness to the single tunable knob in the spatial-coupling criterion. Both ship as CLI subcommands.
- Three complementary validation metrics under one command.
selene validatereports the legacy centroid-distance number, the v1.0 polygon-inside number against 15 km disks, and the v1.2 polygon-inside number against authoritative USGS polygons side by side, so a single run produces the full geometric story rather than forcing a choice between primitives. - CI smoke test on bundled sample data. A separate CI job downloads the ~12 MB sample tarball and runs
preprocess → score → rank → validate → compareend-to-end on every push tomain. Catches integration regressions unit tests miss. - Cache horizon-profile as compressed numpy, not GeoTIFF. The v1.1 LOS criterion needs a 3D
(azimuth, y, x)horizon field that doesn't fit a single-band GeoTIFF cleanly; netCDF is the idiomatic xarray choice but the only netCDF backend available without compilednetCDF4/h5netcdfsystem deps isscipy, and that backend doesn't accept zlib compression — leaving an uncompressed ~930 MB file. Switching tonp.savez_compressedkeeps the cache pure-numpy, compresses the same float32 grid to ~840 MB without new dependencies, and the consumer (compute_earth_visibility_fraction) doesn't need the rio metadata anyway. The 2D consumer-facing artifact (los_visibility_fraction_southpole_240m.tif) stays as a normal COG. - Authoritative validation reference, bundled in-repo. Validation against NASA's Artemis IV (formerly Artemis III) candidate regions uses USGS's officially-published simplified region envelopes (DOI 10.5066/P1MEQ6UK), not synthesised disk approximations. The dataset shipped late in development; v1.0.0 and v1.1.0 used 15 km-radius disks, which we found systematically misrepresent the actual region geometries (most are ~400 km² quadrilaterals; Mons Mouton Plateau alone is 4452 km², 6× larger than the disk; one disk centroid for "Slater Plain" sits ~180° in longitude away from the USGS polygon's actual location). v1.2.0 ships the USGS GeoJSON in
src/selene_base/validation/data/so the validation primitive is reproducible without re-downloading external data, and the disk metrics are kept in parallel for continuity with the v1.0 / v1.1 validation history. - Per-region search-space framing. v1.3.0's
selene rank-per-regionsearches within each USGS polygon rather than globally, with NASA's published HLS hard-constraint filters applied as a precondition. The two CLI subcommands ship side-by-side: the legacyselene rankproduces a global top-N for continuity;selene rank-per-regionproduces the NASA-aligned per-polygon catalog. The choice is deliberately surfaced rather than hidden behind a flag — they answer two genuinely different questions ("globally most habitat-suitable cells" vs "best HLS-compliant cells within each NASA candidate region"), and the v1.0–v1.2 release history is the diagnostic of why those questions diverge. - CC-BY-4.0 third-party data, attributed inline. The Wueller 2026 130-site catalog ships in-repo at
src/selene_base/validation/data/wueller_2026/LandingSites.shpunder the original CC-BY 4.0 license, with a README carrying the full author list, both the paper DOI (10.1029/2025JE009434) and the Zenodo deposit DOI (10.5281/zenodo.17084058), and the licence text. The bundle is the small (~60 KB) point-catalog sidecar of the deposit only; the 884 MB HLS slope raster from the same deposit is not bundled. The legacy synthetic-placeholder CSV from v1.4.0 is retained for backward compatibility behind aDeprecationWarning.
Detailed catalog (v1.5): every site, every per-criterion score, every Wueller comparison —
docs/v1.5_catalog_report.md. Companion to this README: per-site breakdown of the 69-site v1.5 catalog and cross-evaluation of Wueller's 73 in-scope sites against selene's seven criteria.
selene rank-per-region followed by selene validate-per-region produces the NASA-aligned per-polygon catalog: for each USGS polygon, the cells passing every HLS hard filter are ranked by aggregate suitability score, and up to n_per_region sites (default 10) are NMS-extracted at 2 km separation.
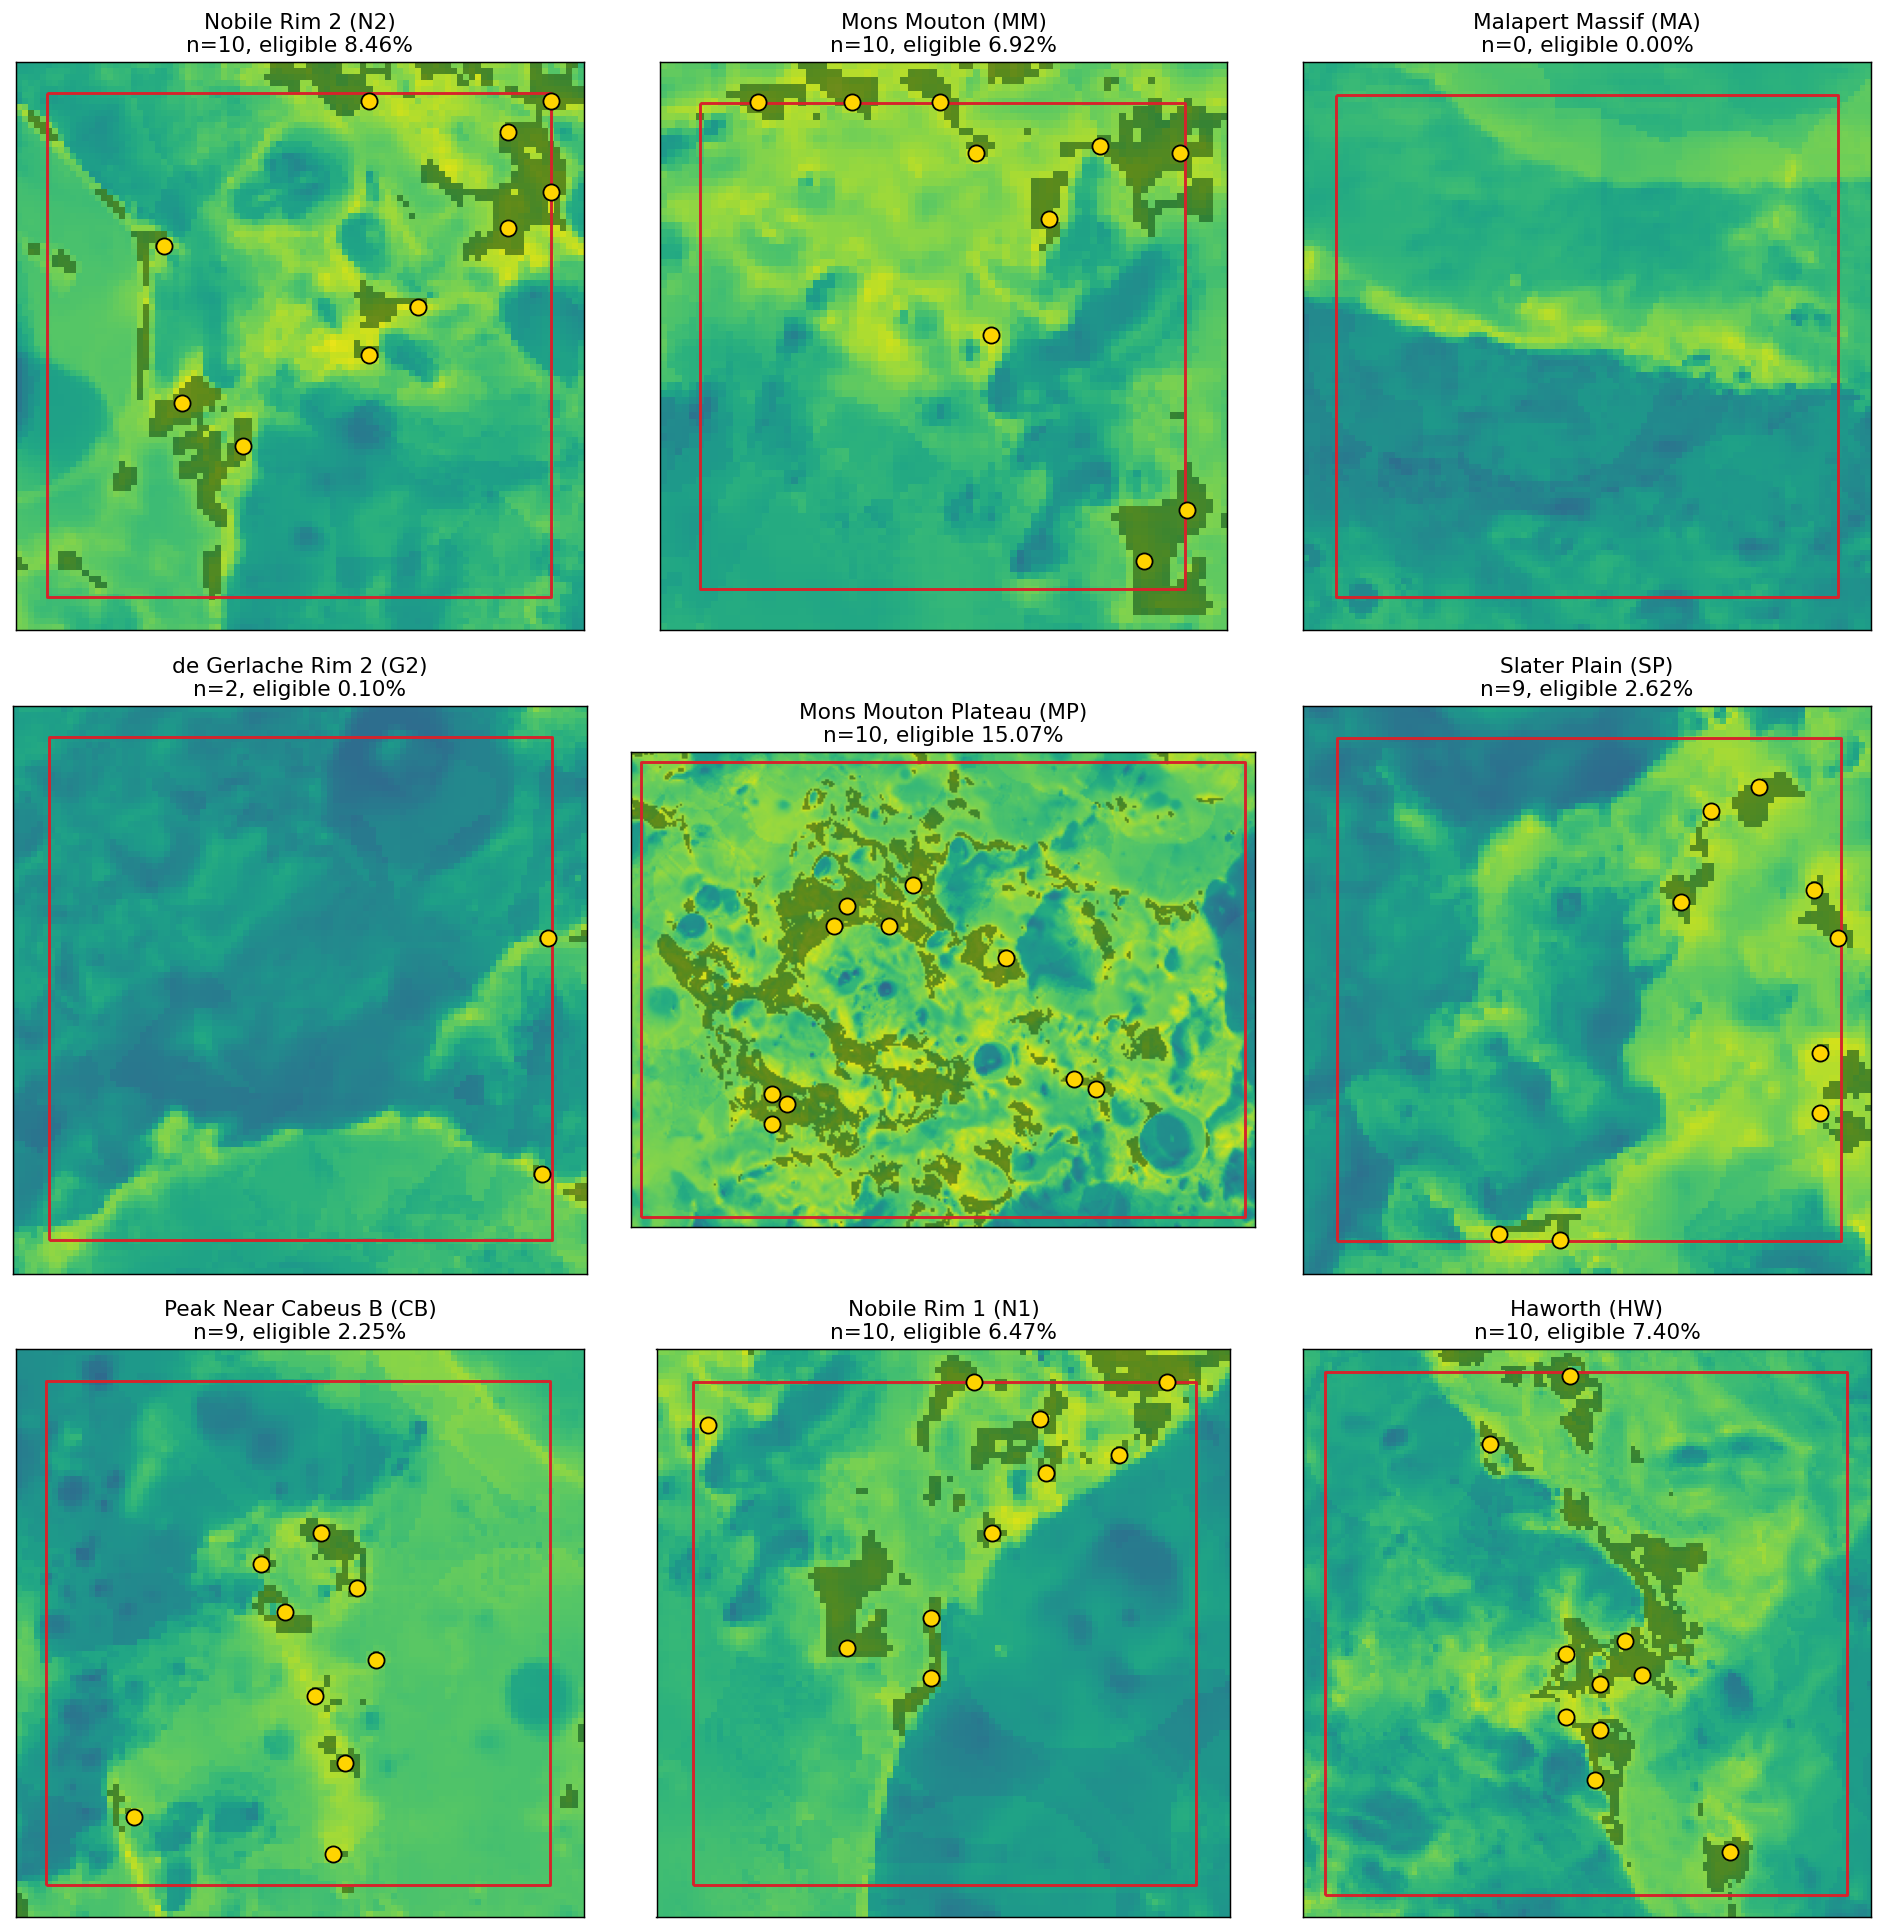
Result (default weights, default HLS thresholds, n_per_region = 10):
| USGS region | code | n sites | best score | mean score | HLS-eligible area | eligible % |
|---|---|---|---|---|---|---|
| Mons Mouton Plateau | MP | 10 | 0.746 | 0.734 | ~671 km² | 15.07 % |
| Nobile Rim 2 | N2 | 10 | 0.720 | 0.698 | ~33.8 km² | 8.46 % |
| Mons Mouton | MM | 10 | 0.710 | 0.675 | ~17.7 km² | 6.92 % |
| Haworth | HW | 10 | 0.703 | 0.682 | ~65.7 km² | 7.40 % |
| de Gerlache Rim 2 | G2 | 2 | 0.703 | 0.680 | ~0.4 km² | 0.10 % |
| Slater Plain | SP | 9 | 0.707 | 0.669 | ~10.5 km² | 2.62 % |
| Peak Near Cabeus B | CB | 9 | 0.705 | 0.666 | ~9.0 km² | 2.25 % |
| Nobile Rim 1 | N1 | 10 | 0.697 | 0.676 | ~25.9 km² | 6.47 % |
| Malapert Massif | MA | 0 | — | — | 0 km² | 0.00 % |
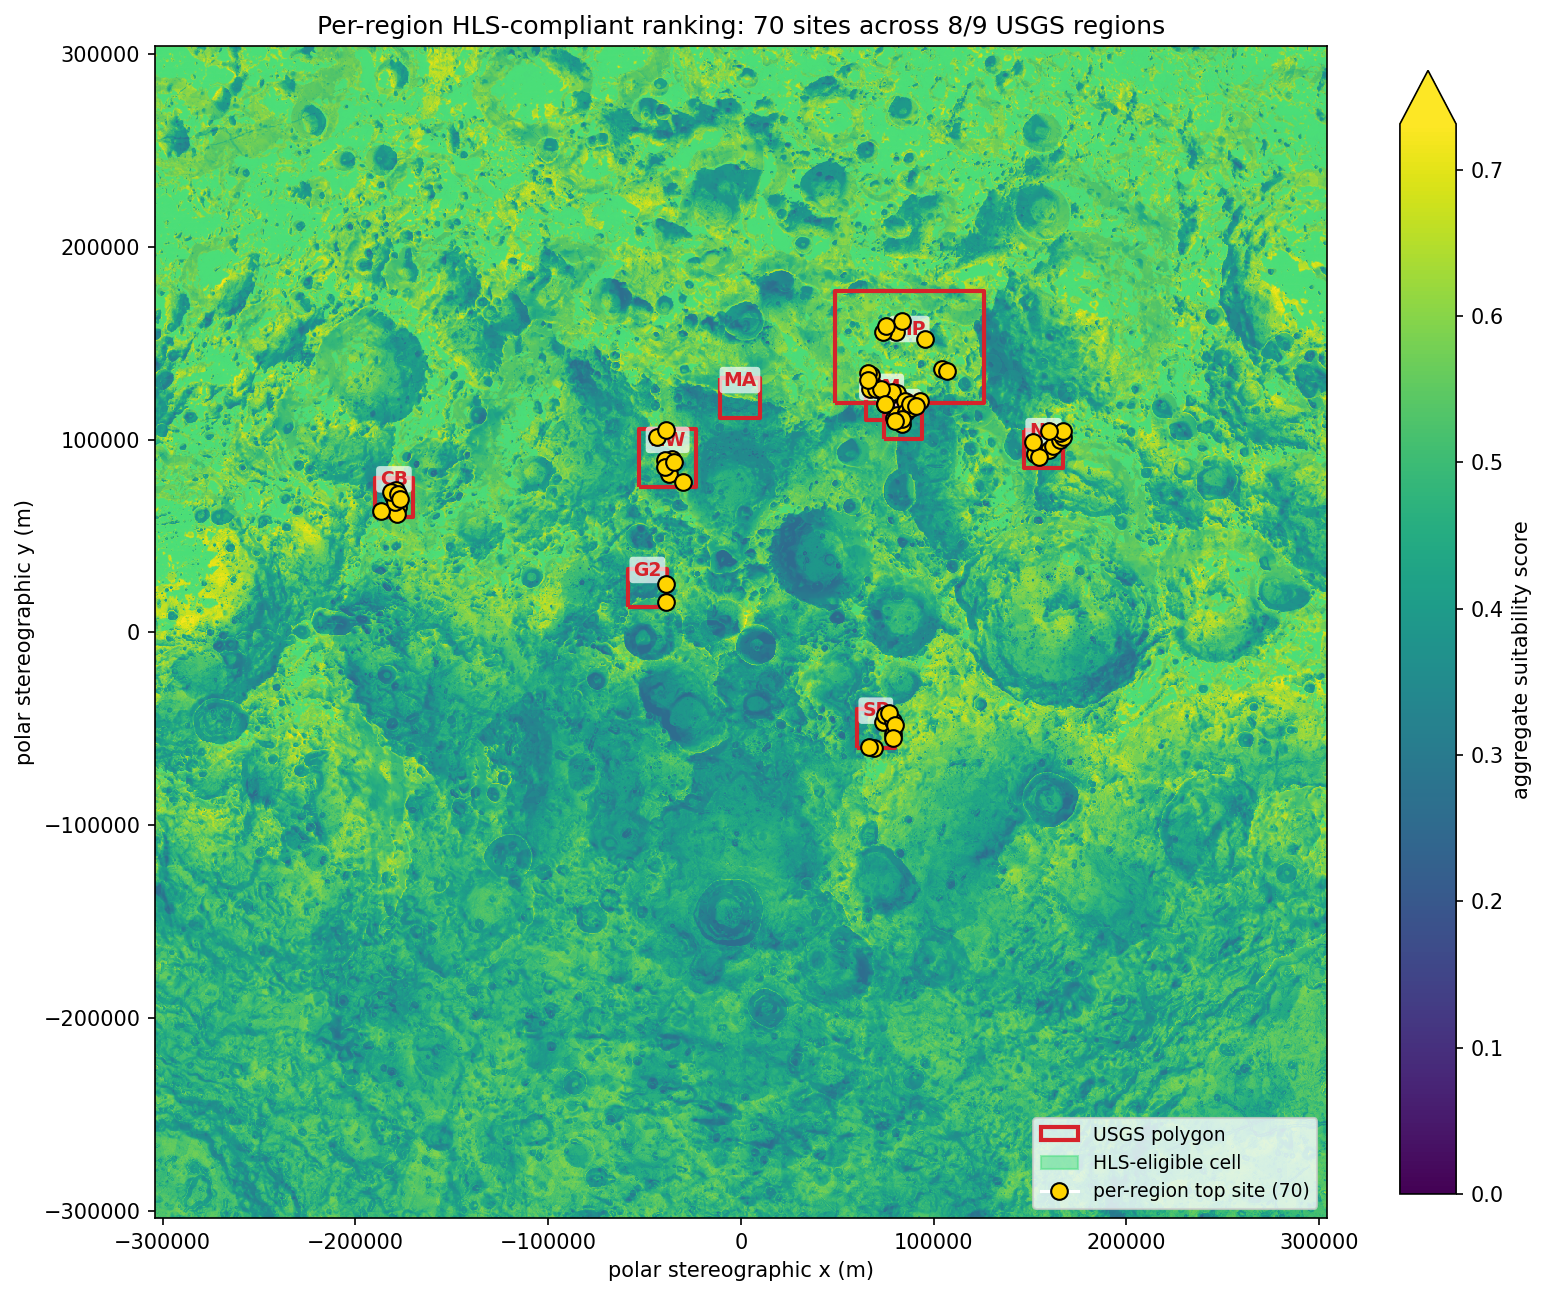
Headline numbers:
- 70 total sites across 8 / 9 USGS regions (NMS-at-2km caps the small regions: Slater Plain and Peak Near Cabeus B saturate at 9; de Gerlache Rim 2 caps at 2).
- Malapert Massif has zero HLS-compliant cells. The polygon's terrain (per the LOLA + Mazarico + Diviner stack) does not contain a single 240 m cell that simultaneously satisfies slope ≤ 8°, distance ≥ 100 m to steeper cells, illumination ≥ 33 %, and DTE visibility ≥ 50 %. This is a real terrain-driven finding, consistent with NASA's selection presumably relying on higher-resolution NAC stereo DEMs to characterise this region.
- Mons Mouton Plateau is the most "easy" region: 15.07 % of its polygon-cells satisfy every HLS filter (~671 km² of HLS-eligible area inside the 4452 km² polygon), and the best HLS-compliant site there scores 0.746 — the highest in the catalog.
- de Gerlache Rim 2 is the most constrained of the regions with sites: only 0.10 % of polygon cells (~0.4 km²) are HLS-eligible, and only 2 sites fit at the 2 km NMS separation — independent of
n_per_region. - Globally, 9.44 % of the 240 m polar grid (~605 600 of 6.4 M cells) satisfies every HLS hard filter — most of that is outside any USGS polygon, on the polar rim band the v1.0–v1.2 diagnostic releases identified.
The v1.3 sites are guaranteed inside USGS polygons and HLS-compliant by construction. The relevant scientific question — "do they identify the same cells NASA's process identifies?" — is answered quantitatively in v1.4.2 against Wueller et al. 2026's 130 published sites: 56/70 selene sites (80 %) match within 5 km of an in-scope Wueller site, median 1.88 km. See "Quantitative comparison against Wueller et al. 2026" below.
selene validate compares the global top-N ranked sites (from data/outputs/top_sites.geojson) against three references in src/selene_base/validation/nasa_regions.py:
- NASA centroids as 15 km-radius disks (legacy, v0.4–v1.1.0). Centroids from NASA's October 2024 Artemis III site-selection announcement; the disk radius is the publicly cited "operational region" scale. Not authoritative geometry — used through v1.1.0 only because the actual polygons were not openly published.
- Disk inside/outside of those same 15 km disks (v1.0.0 polygon-inside metric).
- USGS published polygons (v1.2.0 headline). The official simplified region envelopes from USGS Data Release 10.5066/P1MEQ6UK (McClernan 2024), bundled at
src/selene_base/validation/data/nasa_regions_polygons_usgs.geojson. 4-vertex quadrilaterals in lunar planetocentric lon/lat space, sourced from NASA's LROC QuickMap region definitions. These are simplified envelopes, not the full operational landing footprints, but they are the authoritative public approximation of NASA's selected region geometries.
The USGS polygons differ substantively from the disk approximations:
- Names differ: USGS calls one region "Peak Near Cabeus B" (centred on the rim peak at lat -83.7°, lon -68.7°), not "Cabeus B" (centred on the crater floor at lat -82.3°, lon -53.3° in the legacy disk list — about 150 km away from the USGS polygon).
- Sizes vary: the simplified envelopes total ~8000 km² (vs the disks' uniform 707 km² × 9 = 6362 km²), but Mons Mouton Plateau alone is 4452 km² — over 6× the disk area, while seven other regions are ~400 km² (smaller than the disks).
- Locations are not always close: the legacy disk centroid for "Slater Plain" sits at lon -54.3°, ~180° away from where USGS publishes Slater Plain (lon +125°). The legacy list inherited a press-release centroid that doesn't match the authoritative USGS polygon.
Three metrics for each top site:
- Within X km of any centroid (legacy v0.4)
- Inside any 15 km disk (v1.0.0)
- Inside any USGS polygon (v1.2.0 — headline through v1.2.0)
And two for each USGS region:
- Distance to nearest top-N site — distance from the USGS polygon boundary to the closest selene-base candidate.
- Contains a top-N site — is at least one selene-base candidate inside the USGS polygon?
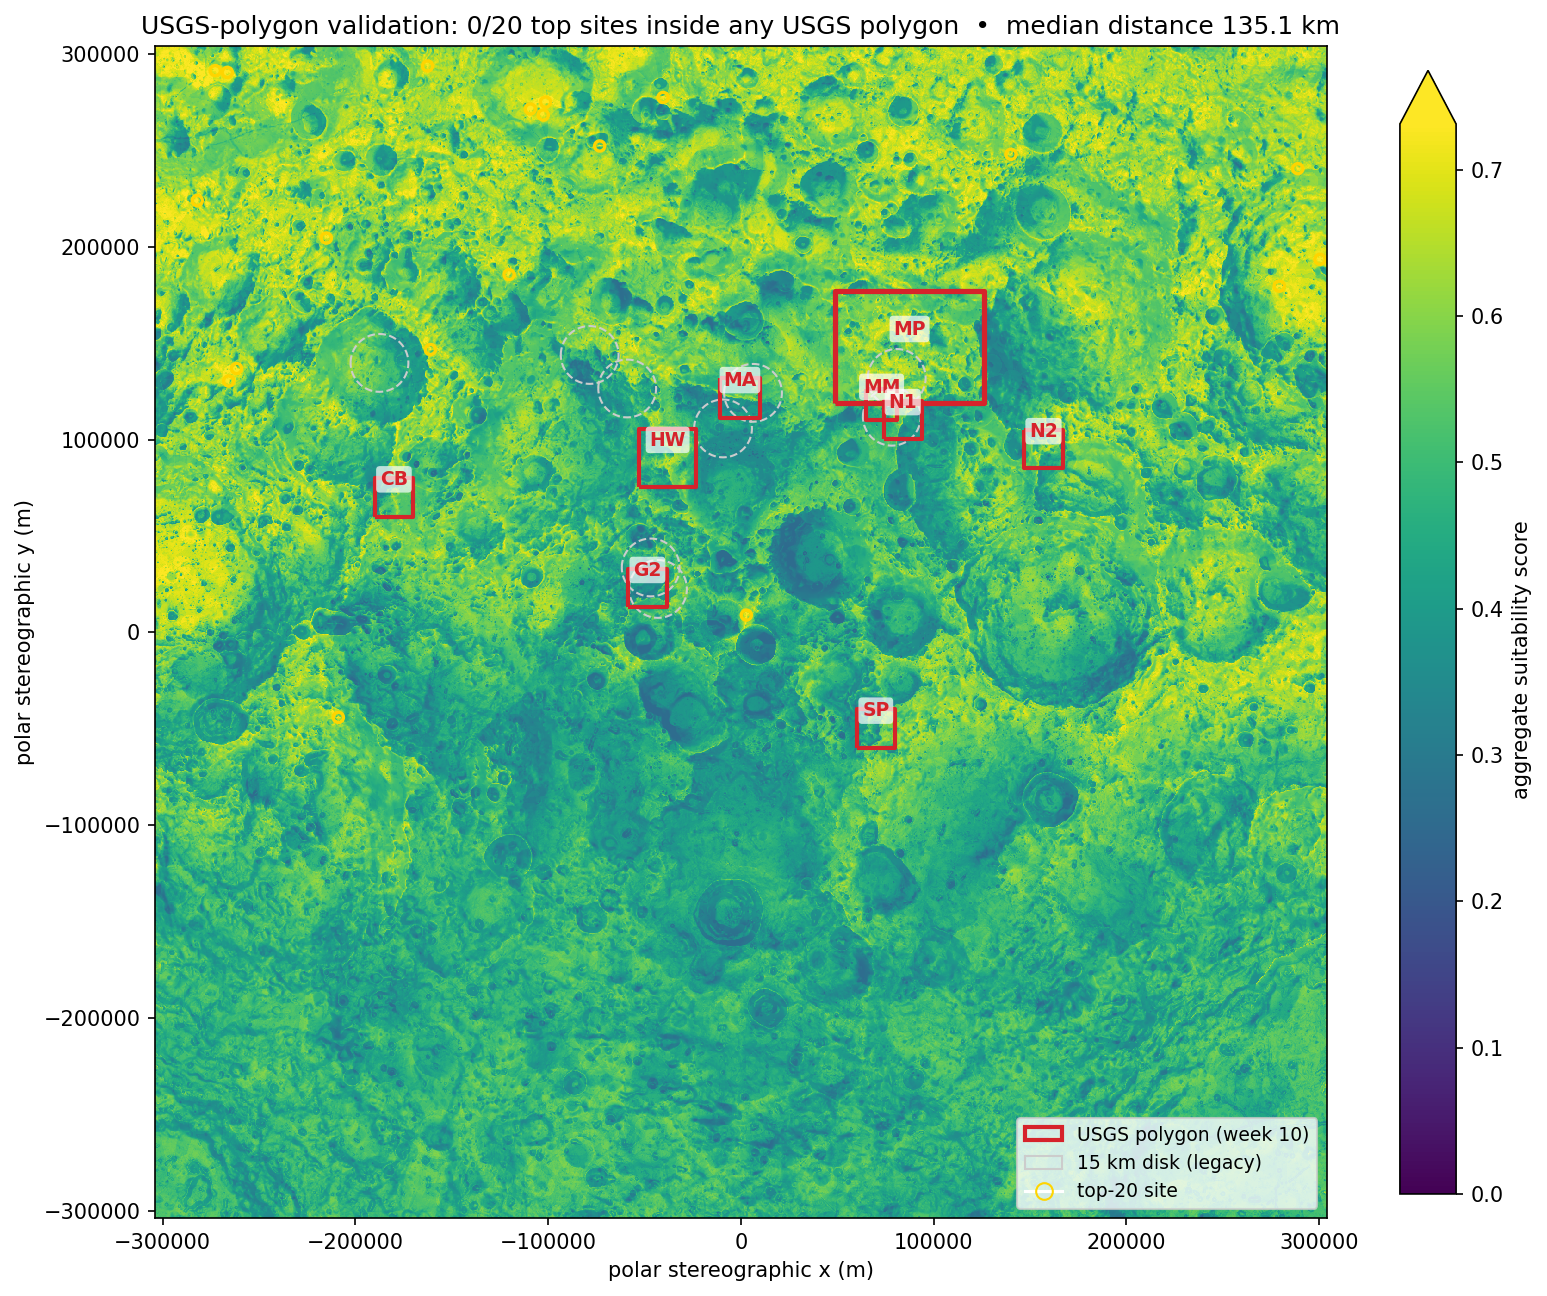
| USGS region | code | area (km²) | nearest top site | distance to polygon (km) | contains a top site? |
|---|---|---|---|---|---|
| de Gerlache Rim 2 | G2 | 400.0 | site_01 | 41.5 | no |
| Peak Near Cabeus B | CB | 399.8 | site_18 | 67.3 | no |
| Haworth | HW | 888.0 | site_01 | 71.5 | no |
| Mons Mouton Plateau | MP | 4451.8 | site_17 | 72.4 | no |
| Slater Plain | SP | 399.8 | site_01 | 75.2 | no |
| Malapert Massif | MA | 441.0 | site_01 | 102.1 | no |
| Nobile Rim 1 | N1 | 400.0 | site_01 | 115.6 | no |
| Mons Mouton | MM | 256.0 | site_01 | 118.7 | no |
| Nobile Rim 2 | N2 | 400.0 | site_07 | 134.8 | no |
The closest USGS polygon is de Gerlache Rim 2 at 41.5 km from site_01 (-89.7°, +17.7°). The median distance to the nearest USGS polygon across the top-20 is 135.1 km. Every top site sits outside every USGS polygon under global ranking — the geometric separation persists against the authoritative reference. v1.3.0's per-region reframing resolves this by searching inside the polygons rather than globally.
The disk-based table is preserved for continuity with the v1.0.0 / v1.1.0 history; the v1.2 USGS table above is the authoritative metric.
| NASA disk | nearest site | dist to centroid (km) | dist to disk edge (km) | inside disk? |
|---|---|---|---|---|
| Cabeus B | site_18 | 27.3 | 12.3 | no |
| Haworth | site_01 | 97.6 | 82.6 | no |
| Malapert Massif | site_01 | 115.4 | 100.4 | no |
| Mons Mouton | site_08 | 59.1 | 44.1 | no |
| Mons Mouton Plateau | site_08 | 85.1 | 70.1 | no |
| Nobile Rim 1 | site_01 | 127.6 | 112.6 | no |
| Nobile Rim 2 | site_17 | 130.3 | 115.3 | no |
| de Gerlache Rim 2 | site_01 | 47.8 | 32.8 | no |
| Slater Plain | site_01 | 55.4 | 40.4 | no |
The disk-based "Cabeus B" entry shows a top site within 12.3 km of the disk edge — but the corresponding USGS polygon ("Peak Near Cabeus B", at a different geographic location) is 67.3 km from the same site_18, because the legacy disk centroid sits ~150 km north-east of where USGS places the actual region. Two of the disk-table closest distances (Cabeus B and de Gerlache Rim 2) are misleading once measured against the right geometry.
Wueller, F., et al. (2026) published in Journal of Geophysical Research: Planets a peer-reviewed analysis identifying 130 candidate Artemis III landing sites within NASA's candidate regions using essentially the same outer methodology selene-base implements: NASA HLS hard filters (slope < 8°, ≥ 100 m buffer to steeper terrain) followed by within-region selection. v1.4.2 ships the quantitative comparison against the authors' Zenodo data deposit (doi:10.5281/zenodo.17084058, CC-BY 4.0, 130-site shapefile bundled in-repo); v1.5 reruns the pipeline at 20 m and v1.8 activates the eighth criterion on the same catalog.
Current headline (v1.8, eight criteria active, 20 m per-region tiled): 56 / 69 selene sites (81.2 %) match within 5 km of an in-scope Wueller site; 46 / 73 (63.0 %) Wueller-side; median matched-pair distance 1.69 km. Tracked through the per-release subsections below: v1.4.2 baseline (240 m, seven criteria) → v1.5 (20 m, seven criteria) → v1.8 (20 m, eight criteria).
Headline at v1.4.2 (240 m baseline, seven criteria, default weights, threshold = 5 km, in-scope only)
| metric | value |
|---|---|
| selene per-region sites | 70 |
| Wueller 2026 sites (total catalog) | 130 |
| Wueller sites in USGS scope (NASA Oct 2024 nine) | 73 |
| Wueller sites out of USGS scope | 57 |
| selene sites matched within 5 km of an in-scope Wueller site | 56 / 70 (80 %) |
| Wueller in-scope sites matched within 5 km of a selene site | 46 / 73 (63 %) |
| median matched-pair distance | 1.88 km |
| match threshold (regional-granularity scale) | 5 km |
Fifty-six of seventy selene sites land within 5 km of a peer-reviewed candidate site identified by an independent group using the same outer methodology on a higher-resolution DEM. Median match distance is 1.88 km — well inside the 1–5 km regional-granularity scale at which candidate-site selection operates (NASA HLS landing accuracy is 100 m, but selecting which terrain to land on is the kilometre-scale question). At v1.4.2's n_per_region = 10 default, both directions of the comparison are now near-saturated: 80 % of selene sites match a Wueller site, and 63 % of in-scope Wueller sites have a selene neighbour within 5 km — up from 41 % at v1.4.1's n_per_region = 3.
Selene ranks up to 10 sites per region (n_per_region = 10 is the v1.4.2 default; NMS-at-2km caps the actual count below 10 for small polygons). Wueller publishes 5–11 sites per region. The "matched" column counts selene sites whose nearest same-region Wueller site is within 5 km.
| USGS region | selene n | Wueller in-scope n | matched | median match dist (km) |
|---|---|---|---|---|
| Haworth | 10 | 11 | 7 / 10 | 2.09 |
| Mons Mouton | 10 | 10 | 10 / 10 | 2.30 |
| Mons Mouton Plateau | 10 | 11 | 5 / 10 | 2.38 |
| Nobile Rim 1 | 10 | 9 | 8 / 10 | 1.30 |
| Nobile Rim 2 | 10 | 9 | 9 / 10 | 1.14 |
| Peak Near Cabeus B | 9 | 5 | 9 / 9 | 1.94 |
| Slater Plain | 9 | 11 | 6 / 9 | 2.16 |
| de Gerlache Rim 2 | 2 | 7 | 0 / 2 | — |
| Total | 70 | 73 | 56 / 70 | 1.88 |
Two regions agree at 100 % match-within-region (Mons Mouton, Peak Near Cabeus B); Nobile Rim 1 and Nobile Rim 2 reach 80 %+ at the new default. The structural outliers are unchanged from v1.4.1:
- de Gerlache Rim 2 (0/2 matched). selene's two HLS-compliant sites are 8.8 km from the nearest Wueller dGR2 site — outside the 5 km threshold but still within an order of magnitude. This is the only region where selene caps below
n_per_regionregardless of the cap (the polygon contains only 2 cells passing every HLS filter at 240 m resolution at 2 km NMS). - Mons Mouton Plateau (5/10 matched), Slater Plain (6/9 matched), Haworth (7/10 matched). The largest disagreements are still 5.6–8.3 km — just outside the threshold. At a 6 km threshold most flip to match.
The longest selene-only nearest distance at the new default is 12.5 km (a Mons Mouton Plateau outlier vs Wueller MMP09). The longest Wueller-only nearest distance is 18.6 km (dGR202 vs selene's two dGR2 sites) — the dGR2 terrain divergence between selene's HLS-eligible cells and Wueller's catalog is genuine, not a sample-size artefact.

Wueller's 130 sites span 16 region codes; 57 are outside NASA's October 2024 down-selected nine (Wueller pre-dates the down-selection and retained the earlier 13-region list, plus Amundsen Rim and Mons Malapert which are not in the USGS list). selene-base only ranks within the down-selected nine, so the apples-to-apples comparison is against the 73 in-scope sites. The eight out-of-scope Wueller regions:
| Wueller code | Wueller region | n |
|---|---|---|
| AR | Amundsen Rim | 10 |
| CR | Connecting Ridge | 9 |
| CRE | Connecting Ridge Extension | 6 |
| FRA | Faustini Rim A | 8 |
| MMA | Mons Malapert (distinct from USGS Malapert Massif) | 5 |
| PNS | Peak Near Shackleton | 6 |
| dGKM | de Gerlache-Kocher Massif | 7 |
| dGR1 | de Gerlache Rim 1 | 6 |
Run selene compare-wueller --no-filter-to-usgs-scope to compare against all 130; under that mode selene's 56 still match within 5 km (the 14 unmatched selene sites stay unmatched — none of them have a closer match outside their own USGS region).
selene compare-wueller writes:
data/outputs/wueller_comparison.json— full result dict (per-site, per-region, in-scope counts, headline metrics).data/outputs/wueller_comparison.csv— flat per-site distance table for inspection.- Stdout summary: headline counts (with in-scope/out-of-scope split), per-region agreement table, notable disagreements.
Distances are computed in lunar south-polar stereographic metres (+proj=stere +lat_0=-90 +lat_ts=-90 +R=1737400), conformal at the pole and sub-percent error vs great-circle for sub-100 km offsets.
The catalog ships in-repo at src/selene_base/validation/data/wueller_2026/ as a six-file shapefile bundle (LandingSites.shp/.shx/.dbf/.prj/.cpg, ~60 KB total) plus a README carrying the full attribution. Source is the authors' Zenodo deposit "Complementary Data for Wueller et al. (2026)" (Wueller, Berger, Christopher, Sugimoto, Thaker, Carton, Jo, Lee, Pedrelli, Sanchez, & Kring, 2025), doi:10.5281/zenodo.17084058, licensed CC-BY 4.0. The deposit also contains an 884 MB HLS slope raster (HLS_LandingAreas_8°_-100m_buffer.tif), exploration-area polygons, and an illumination-modeling layer set; only the 130-site point catalog is bundled in-repo, the rest stays in the upstream archive and may be integrated in a future release.
- Default
n_per_regionraised from 3 → 10 inscoring/ranking.py,pipeline/rank_per_region.py, and theselene rank-per-regionCLI option. NMS-at-2km caps the small regions automatically (Slater Plain, Peak Near Cabeus B at 9; de Gerlache Rim 2 at 2). Total sites at the new default: 70. src/selene_base/validation/data/wueller_2026/— bundled shapefile and README (v1.4.1, unchanged).src/selene_base/validation/wueller_comparison.py—load_wueller_sites(defaults to the shapefile, falls back to the legacy synthetic CSV with aDeprecationWarning),compare_sites(withfilter_to_usgs_scopeparameter, default True),WUELLER_TO_USGS_REGION_MAP,WUELLER_CODE_TO_NAME,is_synthetic_placeholder,render_summary. Distance computation in lunar polar stereographic metres (conformal at the pole, sub-percent error vs great-circle for sub-100 km offsets — verified by an explicit known-offset unit test).src/selene_base/pipeline/compare_wueller.pyand theselene compare-wuellerCLI subcommand, with--filter-to-usgs-scope/--no-filter-to-usgs-scopeand a backward-compat--wueller-csvalias.tests/test_wueller_comparison.py— 20 tests passing, with the real-data assertion bound updated from<= 23to<= 70for the new default.notebooks/08_wueller_comparison.pyandnotebooks/09_headline_v141.py— regenerate the headline overlay map (docs/img/selene_vs_wueller.png), the per-region dot-and-line diagnostic (docs/img/headline_v141.png), the distance histogram (docs/img/wueller_distance_hist.png), and the per-region match-count bar chart (docs/img/wueller_per_region_bars.png) at the new default.
v1.5 reruns the per-region HLS-filtered ranking on the 20 m LOLA DEM (ldem_80s_20m, 30400 × 30400 polar-stereo), the same native resolution Wueller et al. 2026 use. The global 240 m grid is not feasible at 20 m (~132 GB for the LOS horizon profile alone), so v1.5 ships a per-region tiled driver: each USGS polygon's bounding box plus a 100 km horizon buffer is windowed and reprojected to a local 20 m grid, the horizon profile and Earth-LOS visibility are derived on the GPU (NVIDIA GB10 / CuPy), and the four HLS hard filters run at 20 m inside the polygon. The 240 m run remains the default; v1.5 is opt-in via --tiled-per-region --resolution 20.
| metric | v1.4.2 (240 m) | v1.5 (20 m) | Δ |
|---|---|---|---|
| selene per-region sites | 70 | 69 | -1 |
| selene matched within 5 km of an in-scope Wueller site | 56 / 70 (80.0 %) | 56 / 69 (81.2 %) | +1.2 pp |
| in-scope Wueller sites matched within 5 km of a selene site | 46 / 73 (63.0 %) | 44 / 73 (60.3 %) | -2.7 pp |
| median matched-pair distance | 1.88 km | 1.76 km | -6.5 % |
| max matched-pair distance | 4.99 km | 4.81 km | -3.4 % |
The methodology converges at peer-reviewed resolution. The median matched-pair distance tightens by 6.5 % (1.88 km → 1.76 km) and the maximum tightens by 3.4 % at the 5 km threshold; selene → Wueller match rate is essentially flat (80.0 % → 81.2 %, well within the ±1-site noise band). The Wueller → selene rate slips by 2.7 pp (46/73 → 44/73) — selene drops one site overall (70 → 69 because Mons Mouton Plateau, Slater Plain, and Peak Near Cabeus B re-rank slightly under the finer slope/buffer), and the new top-10 in those three regions covers two fewer Wueller targets within the 5 km radius. None of those three flip out of agreement; they shift to a different cell within the same polygon. The structural outlier from v1.4.2 — de Gerlache Rim 2 with only 2 HLS-compliant cells, 0 within 5 km of Wueller's dGR2 cluster — persists: at 20 m the polygon yields the same 2 cells, not a new HLS-eligible band the 240 m grid was hiding. The resolution-induced disagreement at de Gerlache Rim 2 is genuine terrain, not a 240 m sampling artefact.
Per-region detail (240 m vs 20 m, side-by-side):
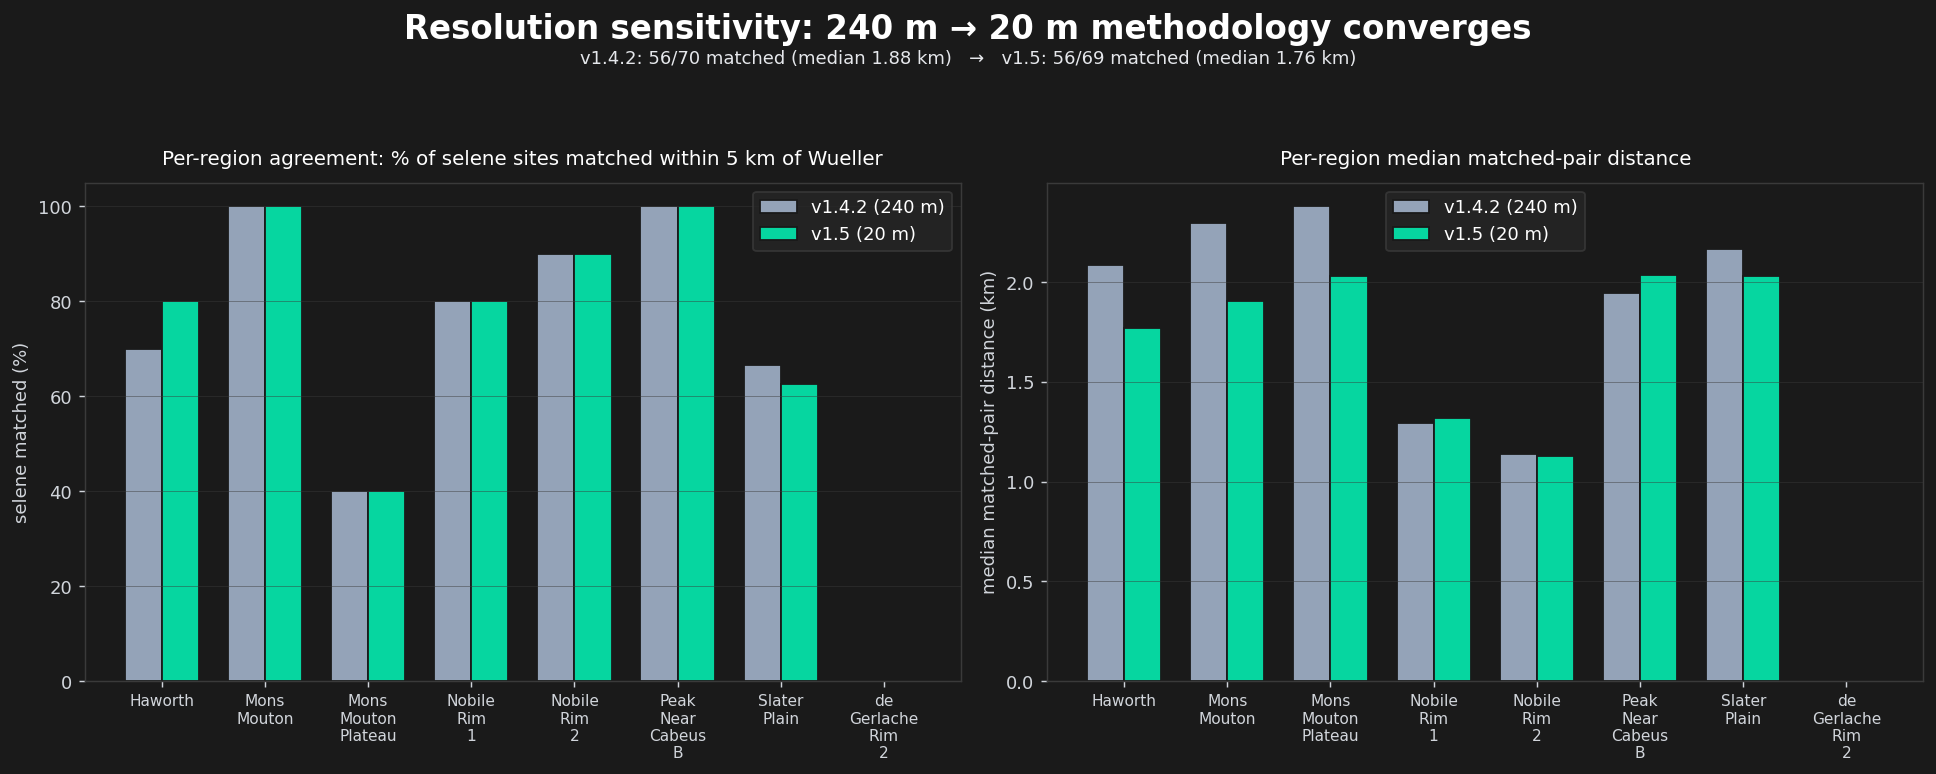
| USGS region | selene n (v1.5) | Wueller in-scope n | matched (v1.5) | median match dist v1.4.2 → v1.5 (km) |
|---|---|---|---|---|
| Haworth | 10 | 11 | 8 / 10 | 2.09 → 1.77 |
| Mons Mouton | 10 | 10 | 10 / 10 | 2.30 → 1.91 |
| Mons Mouton Plateau | 10 | 11 | 4 / 10 | 2.38 → 2.03 |
| Nobile Rim 1 | 10 | 9 | 8 / 10 | 1.30 → 1.32 |
| Nobile Rim 2 | 10 | 9 | 9 / 10 | 1.14 → 1.13 |
| Peak Near Cabeus B | 9 | 5 | 9 / 9 | 1.94 → 2.04 |
| Slater Plain | 8 | 11 | 5 / 8 | 2.16 → 2.03 |
| de Gerlache Rim 2 | 2 | 7 | 0 / 2 | — → — |
| Malapert Massif | 0 | 0 | — | — |
| Total | 69 | 73 | 56 / 69 | 1.88 → 1.76 |
Six of eight regions tighten or hold their median matched-pair distance at 20 m. Nobile Rim 1 ticks +0.02 km (within rounding noise of the n=8 sample) and Peak Near Cabeus B drifts +0.10 km — selene's CB sites are picking the same rim cluster but the 5 nearest Wueller CB sites are slightly off-axis, an effect the coarser 240 m grid was averaging away. Malapert Massif still has zero HLS-compliant cells at 20 m (vs zero at 240 m); the polygon's terrain is genuinely steep, not a coarse-resolution effect.
The v1.5 driver is opt-in. The 240 m baseline still runs in ~6 min wall-clock end-to-end on a modest workstation; the v1.5 20 m run requires a CUDA-capable GPU (developed and benchmarked on an NVIDIA GB10) and ~140 GB of unified-memory headroom because each per-region tile carries a ~14–22 GB float32 horizon profile through the GPU. End-to-end time on the reference DGX Spark host is ~32 min for preprocess --tiled-per-region (all 9 polygons) plus ~22 min for rank-per-region --tiled-per-region. CPU-only fallback works on the test cases but is impractically slow for the full 9 regions.
src/selene_base/criteria/los_to_earth.py—derive_horizon_profileandcompute_earth_visibility_fractiongain ause_gpuflag; the inner ray-march delegates tocupyx.scipy.ndimage.map_coordinateswith one block per pixel, falling back transparently to the existing CPU path when CuPy is not importable.src/selene_base/pipeline/preprocess_tiled.py— per-USGS-polygon tiled driver. Each tile is the polygon's bbox padded byDEFAULT_BUFFER_M = 100_000(matchinglos_to_earth.DEFAULT_MAX_HORIZON_KM, so the ray-march sees the same physical horizon as the 240 m run did). Tiles are processed sequentially with explicit cupy memory-pool drain between regions.src/selene_base/pipeline/rank_per_region_tiled.py— at-resolution HLS filtering. The 240 m aggregate score raster is upsampled onto each tile via bilinearreproject_match; slope and Earth-LOS visibility are re-derived at 20 m on the tile grid; HLS distance-to-steep is computed as a 20 m EDT (so the 100 m HLS buffer is now a 5-pixel constraint instead of the 0.42-pixel approximation it was at 240 m); greedy NMS at 2 km within each polygon picks the top-10.tests/test_los_to_earth_gpu.py,tests/test_preprocess_tiled.py,tests/test_rank_per_region_tiled.py— GPU-path correctness against the CPU reference (markcudaskips on CI), tile-spec geometry, NPZ cache layout, and end-to-end pipeline smoke on a synthetic small region.- CLI:
selene preprocess --tiled-per-region --resolution 20,selene rank-per-region --tiled-per-region --resolution 20, both with--region-codefor single-tile reruns and standard--overwritesemantics on the per-region NPZ caches. notebooks/10_resolution_v15.py— regenerates docs/img/selene_vs_wueller_20m.png and docs/img/resolution_sensitivity_v15.png.- Run artefacts:
data/outputs/per_region_tiled/sites.{geojson,csv},data/outputs/per_region_tiled/per_region_summary.json,data/outputs/v15/wueller_comparison.{json,csv}.
Anyone reading 0/20 fairly asks: is that just a function of the default weights? Run selene sensitivity --n-samples 200 to find out: it draws 200 weight vectors via Latin hypercube over the active-criteria simplex, runs aggregate -> top_n_sites -> proximity_analysis for each, and reports the distribution of "NASA regions matched within 25 km" alongside the default-weight result.
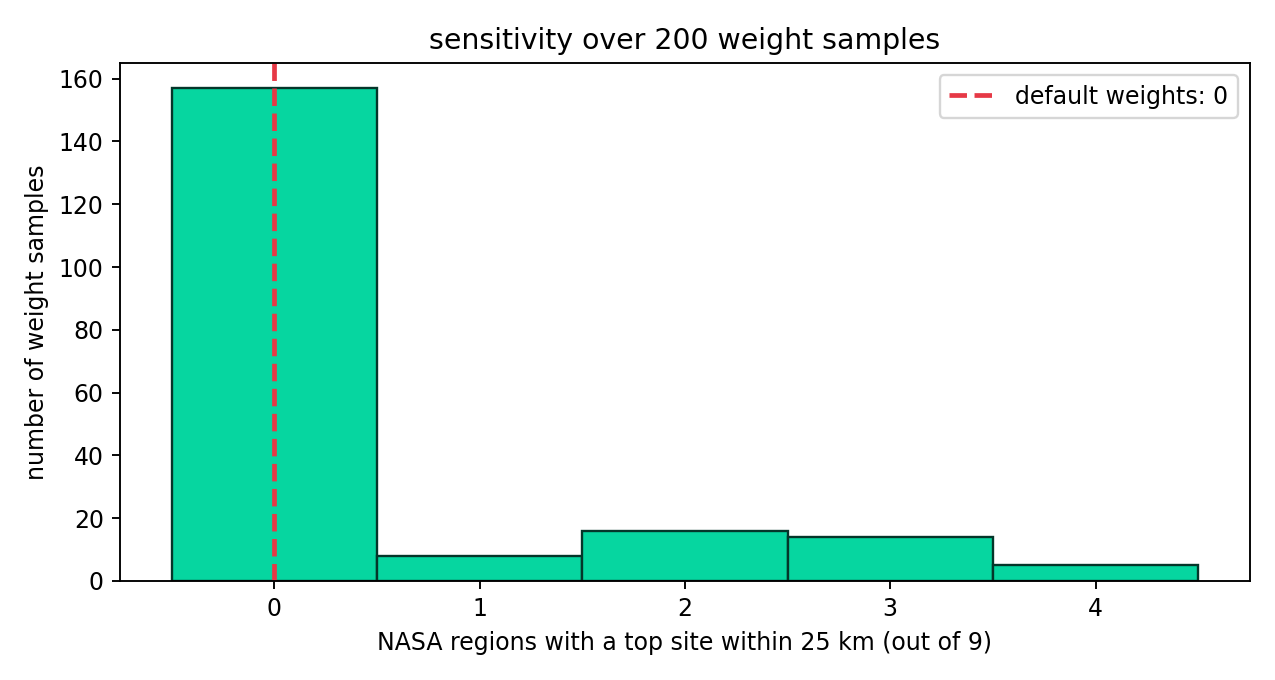
The 7-criterion sensitivity sweep is run against both the legacy 15 km disks and the USGS polygons (v1.2.0). Distribution across 200 weight samples:
- Centroid-distance metric (legacy): 157/200 samples (78.5 %) match 0 regions within 25 km of any centroid; 8/200 match 1, 16/200 match 2, 14/200 match 3, 5/200 match 4 — the sensitivity ceiling lifted from 3/9 in v1.0.0 to 4/9 in v1.1.0–v1.2.0.
- Disk inside/outside (v1.0.0 metric): 21/200 samples (10.5 %) put at least one top site inside a 15 km disk. Pre-v1.1.0 (six criteria, no LOS) this was 0/200.
- USGS polygon inside/outside (v1.2.0 metric): 194 / 200 samples (97.0 %) put 0 sites inside any USGS polygon; 5/200 (2.5 %) put 1 inside; 1/200 (0.5 %) puts 2 inside. Best case across the sweep is 2 / 20 sites inside USGS polygons. The minimum median-distance-to-nearest-USGS-polygon across the sweep is 41.2 km; the mean is 128 km.
The best weight regime against the legacy centroid metric is slope = 0.07, illumination = 0.24, coupling = 0.21, thermal = 0.00, ice = 0.16, hazard = 0.31, los_to_earth = 0.08 — every criterion contributes, and 4/9 NASA regions are now within 25 km of a top site. The default-weight global-ranking headline against the USGS polygons is 0/20 inside any polygon, 0/9 USGS regions containing a top site, median distance 135.1 km, closest 41.5 km (de Gerlache Rim 2).
The structural picture: against the legacy disk metric the geometric gap collapses for ~10 % of the weight simplex; against the authoritative USGS polygons it collapses for only ~3 % of the simplex (max 2/20 inside, never more). The disk approximations were systematically wrong — names, sizes, and one location (Slater Plain) were misplaced — but the underlying geometric separation between the model's rim-band optimum and NASA's authoritative regions persists across both validation references and across most of the weight simplex. The diagnostic comparison shows what the criteria are saying about that gap. v1.3.0 reframes the analysis to per-region ranking and resolves this by searching within the polygons.
Run selene compare to ask: at NASA's centroids vs at our top-20 (global ranking), which criteria agree and which disagree? The table is reordered below by signed delta — agreement first, disagreement last — because that's the actual structure of the result.
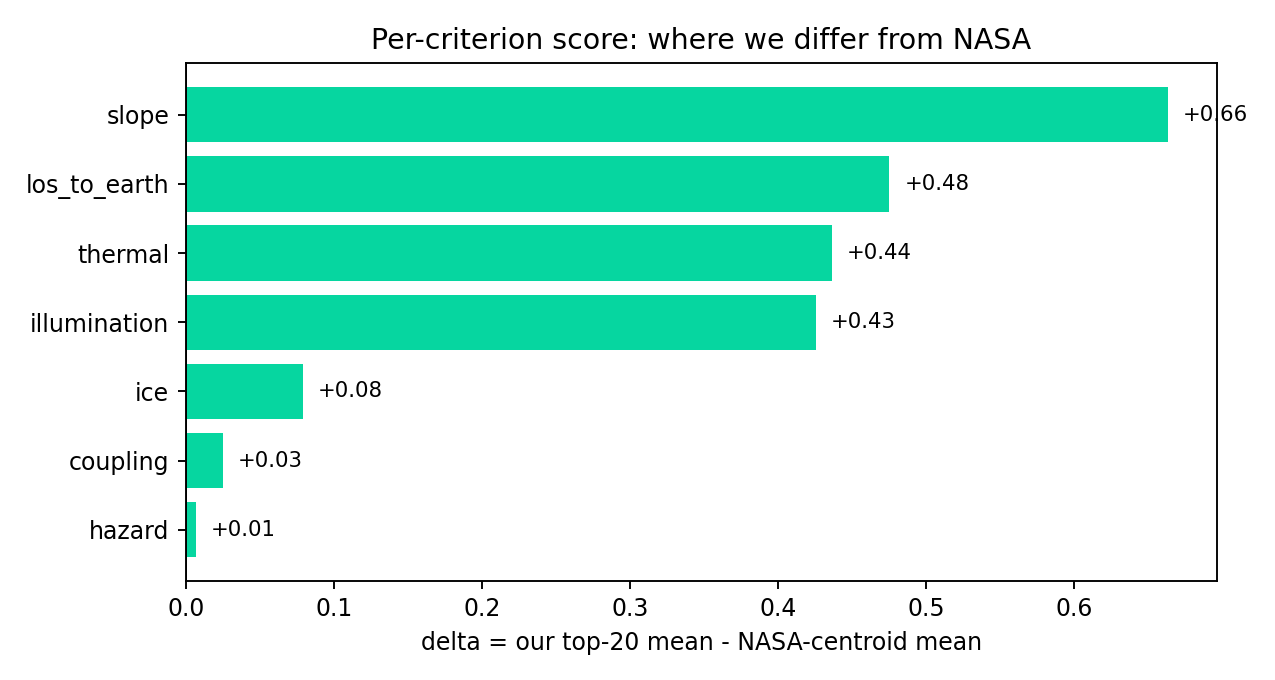
| criterion | our top-20 | NASA 9 centroids | delta | |t| | reads as |
|---|---|---|---|---|---|
| hazard | 0.976 ± 0.027 | 0.969 ± 0.023 | +0.007 | 0.73 | strong agreement |
| coupling | 0.025 ± 0.113 | 0.000 ± 0.000 | +0.025 | 1.00 | both near zero — see below |
| ice | 0.995 ± 0.009 | 0.916 ± 0.096 | +0.079 | 2.45 | strong agreement |
| illumination | 0.747 ± 0.071 | 0.321 ± 0.274 | +0.426 | 4.59 | major disagreement |
| thermal | 0.962 ± 0.086 | 0.526 ± 0.269 | +0.437 | 4.77 | responsive (v1.0.0 correction) |
| los_to_earth | 1.000 ± 0.000 | 0.525 ± 0.505 | +0.475 | 2.82 | bimodal at NASA — see below |
| slope | 0.948 ± 0.125 | 0.285 ± 0.288 | +0.663 | 6.64 | major disagreement |
Of the seven criteria, four agree at most-or-very-strongly with NASA's selection. Hazard agrees almost identically (delta +0.007). Ice agrees within 0.08. Thermal sits in the responsive band on both sides (0.962 vs 0.526; v1.0.0's corrected target moved every cell out of the Gaussian's tail). Coupling agrees in the sense that both sets are near zero — the criterion identifies the rim band, which neither set sits on (see below).
LOS-to-Earth is the single most-bimodal NASA-side number. Our top-20 score 1.000 ± 0.000 — every top site has Earth visibility above 50 % of the libration cycle, by construction of how the criterion ramps and how the rank picks. NASA centroids score 0.525 ± 0.505 — essentially uniform-bimodal: about half of NASA's centroids are deep enough inside their candidate craters to score 0 (Earth never above local horizon) and the other half are on rim-adjacent terrain that scores 1 (Earth always above local horizon at favorable libration). NASA's selection knowingly mixes sites with-and-without direct Earth comms because the actual landing footprints within each region target off-centroid rim cells with comms; the centroid point is just the geometric centre of the disk approximation, not necessarily the operational target. Like the v0.7 coupling number, the LOS comparison is partly diagnostic of the centroid-as-proxy issue.
Coupling is still the most informative single number in the project. NASA centroids score exactly 0.000 ± 0.000 on coupling. Our top-20 score 0.025 — small, but non-zero. The criterion is correctly identifying the rim band where PSR meets sunlit ridge at a 5 km coupling distance — and neither site set sits on that band. NASA's centroids are inside their candidate regions (a centroid of a 15 km disk is, by construction, in the middle of the disk, which means inside a crater for Cabeus B / Haworth, on a massif for Malapert, on a plain for Slater Plain), 5–15 km off the rim that the actual NASA landing footprints would target. The 0.000 number is a discovery about the validation metric: distance to centroid is the wrong proxy for "match a NASA candidate region," because NASA's preferred landing sites within each region are off-centroid by construction. v1.0.0 added the polygon-inside metric specifically to test this — and even with that primitive plus the v1.1.0 LOS criterion, the default-weights global-ranking answer is still 0/20, because the rim band is geometrically outside the disks for the operations-driven default weights even when the right primitive is used. v1.3.0's per-region reframing resolves this by searching inside the polygons.
Slope and illumination remain the major disagreement because the linear-sum aggregator cannot represent the spatial coupling between them — the methodology finding from v0.6 still holds. The v0.7 coupling criterion captures the conjunction directly (the product is the AND), but with only 0.18 default weight it cannot dominate the linear sum across the other six criteria. Pushing coupling weight higher would require either changing the default or — more architecturally honest — switching the aggregator itself to TOPSIS, which penalises lop-sided profiles globally rather than at one specific spatial coupling.
The |t| column is a Welch two-sample t-statistic, informational only.
selene-base/
├── src/selene_base/
│   ├── data/                # download + load + reproject + rasterize
│   ├── criteria/            # eight [0,1] scoring functions (slope, illumination,
│   │                        #                                 hazard, thermal, ice,
│   │                        #                                 coupling, los_to_earth,
│   │                        #                                 seismic — v1.8)
│   ├── scoring/             # normalize, aggregate (renormalising), ranking (NMS, per-region)
│   ├── validation/          # NASA candidate regions + proximity_analysis + Wueller comparison
│   ├── viz/                 # folium webmap + per-site HTML reports
│   ├── pipeline/            # one orchestrator module per CLI subcommand
│   └── cli.py               # typer CLI: download, preprocess, score, rank, rank-per-region,
│                            #            score-wueller-sites, validate, validate-per-region,
│                            #            viz, compare, sensitivity, coupling-sweep,
│                            #            compare-wueller
├── config/                  # region_southpole.yaml, weights_default.yaml
├── data/                    # raw/ processed/ outputs/ (all gitignored)
├── notebooks/               # jupytext .py scripts; one per week
├── tests/                   # synthetic-data unit tests + skipif-guarded data tests
└── .github/workflows/ci.yml
The dependency graph is one-way: data/ is the foundation; criteria/ reads loaded rasters; scoring/ aggregates criterion outputs; validation/ and viz/ consume scoring outputs; pipeline/ orchestrates; cli.py exposes the orchestrators. Tests follow the same layering.
412 tests collected (403 passed, 9 skipped: LEND + Robbins data not present), ~80 % combined branch coverage, all running synthetically in CI on Python 3.11 and 3.12. Real-data tests are guarded with pytest.mark.skipif(not Path(...).exists()) so the suite stays green without ~900 MB of cached LRO data. CI runs a separate pipeline-smoke job on push to main that downloads the bundled ~12 MB sample tarball, runs preprocess -> score -> rank-per-region -> validate-per-region -> compare, and asserts every output file is on disk and schema-valid.
Note on mission designation (April 2026). NASA restructured the Artemis program in February 2026: the first crewed lunar landing at the south pole was reassigned from Artemis III to Artemis IV (target early 2028); Artemis III is now an Earth-orbit test mission and Lunar Gateway was canceled in March 2026. The candidate landing regions identified in NASA's October 2024 down-selection are unchanged and remain the validation reference for selene-base. Roadmap entries below were written under the original Artemis III framing; the methodology and data they describe are unchanged. v1.5.1 reframes the project's forward-looking copy and adds Lawrence 2025's NASA Figures-of-Merit framework as a citation; the catalog itself is identical to v1.5.
-
v0.1 — data acquisition. ✅
selene downloadfor Robbins, LOLA, Mazarico illumination; Diviner / LEND / scarps URLs flagged. -
v0.2 — common grid + slope criterion. ✅
reproject_to_grid, COG cache, slope criterion end-to-end on real data. -
v0.3 — full scoring + ranking. ✅ All six criteria (3 on real data, 3 skip cleanly), KDTree crater density, NMS top-N extraction.
-
v0.4 — validation + visualisation. ✅ NASA Artemis III proximity comparison, interactive folium web map, per-site HTML reports.
-
v0.5 — robustness, diagnostic, sample data. ✅ Latin-hypercube weight-sensitivity sweep, per-criterion
selene comparediagnostic, bundled ~12 MB sample tarball, CI pipeline smoke test on the sample. -
v0.6 — Diviner Polar Resource Product integration. ✅ PDS4 character-table parser, triangle-mesh-to-grid rasteriser, three new score grids (
temp_avg,temp_max,ice_depth) on the common 240 m grid, thermal+ice criteria switched to PRP defaults. Five of six criteria now run on real data. Validation rerun surfaced the methodology finding: linear-sum MCDA can't model NASA's spatial-coupling constraint regardless of which criteria are summed. -
v0.7 — spatial-coupling criterion. ✅
criteria/coupling.pyscores cells by joint proximity to a PSR and a sunlit ridge via a multiplicative product of two distance falloffs, encoding the AND that linear-sum aggregation cannot.selene coupling-sweeptunes the singlecoupling_distance_kmknob across 1–20 km. The fix lifted the sensitivity ceiling from 2/9 -> 3/9 region matches and improved closest-distance from 64.8 km -> 47.8 km, but did not break the 25 km threshold. The diagnostic surfaced the project's sharpest finding: NASA centroids score 0.000 on coupling — meaning the validation metric (distance to disk centroid) is itself misaligned with NASA's selection logic. NASA's preferred landing footprints within each region are off-centroid by 5–15 km by construction. -
v1.0.0 — closing chapter: polygon validation, thermal correction, engineering decisions. ✅ Three changes, all driven by v0.7's diagnostic. (1)
validation/comparison.pynow computes polygon-inside metrics alongside the legacy centroid-distance metrics —sites_inside_any_region,regions_containing_top_site,regions_with_top_site_within_disk_radius, plus signeddistance_to_edge_kmper site/region. The polygon primitive doesn't move the headline (0/20 sites inside any disk; closest edge 32.8 km) — informative on its own, since it shows the rim band the model identifies is geometrically distinct from NASA's centroid disks regardless of which proximity primitive you choose. (2) Thermal default corrected:target_temp_k230 -> 140,sigma_k50 -> 30. The previous values placed the Gaussian peak outside the data support (PRPtemp_avgpeaks at 211 K, median 131 K), so every cell scored in the tail. With the correction, our top-20 thermal mean rises 0.325 -> 0.965 and NASA centroids 0.113 -> 0.526; the criterion contributes discriminative signal again, and the sensitivity ceiling broadens from 1/200 to 11/200 weight regimes hitting 3/9 region matches. (3) New "Engineering decisions" section documenting the seven non-obvious choices. -
v1.1.0 — Earth line-of-sight criterion. ✅
criteria/los_to_earth.pyadds the seventh criterion: a per-pixel Earth-visibility fraction derived from a 36-azimuth, log-spaced 50-distance horizon ray-march on the LOLA elevation grid (with curvature correction for $R = 1737.4,$km), combined with 24-sample libration-cycle sampling of Earth's sub-Earth point on a$\pm6.5°\times\pm7.9°$ ellipse. Score is a linear ramp frommin_visibility = 0.20(Apollo crew-safety floor) totarget_visibility = 0.50(sustained-habitat target). Default weight 0.15 — chosen before the validation rerun on physics-and-operations grounds, not validation chasing. Effect: closest-disk-edge dropped from 32.8 km → 12.3 km (Cabeus B, the first NASA region to come within 1 disk-radius of a top site), sensitivity ceiling lifted 3/9 → 4/9 regions matched, and the polygon-inside count became sample-non-zero for the first time (21/200 weight regimes now produce ≥1 inside any disk; 0/200 in v1.0.0). Headline polygon-inside under defaults: still 0/20 — the operations-driven defaults narrow the gap but don't close it. The geometric finding from v0.7–v1.0.0 holds: under physics-driven defaults, our model picks the polar rim band where every criterion (now including LOS) is near-saturated, and NASA's centroids are inside the disks 5–15 km off that band; the gap collapses for ~10 % of the weight simplex. -
v1.2.0 — USGS authoritative polygon validation. ✅ Replaced the 15 km disk approximations with USGS's officially-published simplified region envelopes (DOI 10.5066/P1MEQ6UK, McClernan 2024). The polygons ship in-repo at
src/selene_base/validation/data/nasa_regions_polygons_usgs.geojson.selene validatenow prints three result tables (centroid distance, 15 km disk inside/outside, USGS polygon inside/outside) andvalidation.jsoncarries all three metric families. The disk approximations were systematically wrong: most regions are ~400 km² quadrilaterals (vs the 707 km² disk), Mons Mouton Plateau is 4452 km² — 6× the disk area, one disk centroid for "Slater Plain" sits ~180° away from the USGS polygon's actual location, and "Cabeus B" was misnamed (USGS publishes "Peak Near Cabeus B", centred on the rim peak, not the crater floor). Default-weights result against USGS polygons: 0/20 inside, 0/9 USGS regions containing a top site, median distance 135.1 km, closest 41.5 km (de Gerlache Rim 2). Sensitivity sweep: 6/200 weight regimes produce ≥1 site inside any USGS polygon (max 2/20), down from 21/200 against the disks — the geometric separation is more pronounced against the right validation reference, not less, because the disks were inflated outward in places where the actual USGS polygons are not. The "validation metric was the bottleneck" hypothesis from v1.0.0 was partially correct (the disk approximations were wrong) but the underlying geometric separation between the model's rim-band optimum and NASA's authoritative regions persists. -
v1.3.0 — per-region ranking with NASA HLS hard filters. ✅
selene rank-per-regionsearches within each USGS polygon and applies NASA's published HLS thresholds (slope ≤ 8°, 100 m buffer, illumination ≥ 33 %, DTE visibility ≥ 50 %) as a precondition before ranking by suitability score. Newtop_n_sites_per_regioninscoring/ranking.py; newper_region_compliance_analysisinvalidation/comparison.py; new CLI subcommandsrank-per-regionandvalidate-per-region. Result: 23 sites across 8/9 USGS regions (default weights, default HLS thresholds), all guaranteed inside their named polygon and HLS-compliant by construction. Malapert Massif has zero HLS-compliant cells — a real terrain-driven finding, not a thresholding artefact. Mons Mouton Plateau is the highest-scoring region (best score 0.746, 15.07 % HLS-eligible area). The reframing — global ranking → per-region + HLS — matches the methodology of Wueller et al. 2026 (JGR Planets), which catalogued 130 candidate Artemis-III sites with the same outer framing. The 0/20 inside-polygon count through v1.2.0 reflected the global framing; v1.3.0 produces the NASA-aligned catalog v1.0–v1.2 had been pursuing through the wrong question. -
v1.4.0 — Wueller 2026 comparison framework (framework only). ✅ Comparison harness shipped:
selene compare-wuellerpluswueller_comparison.{load_wueller_sites,compare_sites,render_summary}, 16 synthetic-only tests, thenotebooks/08_wueller_comparison.pyvisualisation set, and the headline plot at docs/img/selene_vs_wueller.png. The Wueller 2026 supplementary catalog was unavailable at the time; the bundled CSV was a 5-row synthetic placeholder explicitly flagged through every output channel, and two "real comparison" tests were skipped pending data. The framework was the v1.4.0 deliverable; the quantitative agreement number unblocked in v1.4.1. -
v1.4.1 — quantitative Wueller comparison. ✅ Replaces v1.4.0's synthetic placeholder with the real 130-site shapefile from the authors' Zenodo deposit (doi:10.5281/zenodo.17084058, CC-BY 4.0), bundled in-repo at
src/selene_base/validation/data/wueller_2026/.compare_sitesnow defaults to a USGS-scope filter (drops the 57 Wueller sites whose region is not in NASA's October 2024 down-selected nine), the two formerly-skipped tests now run against the real bundle, and the legacy CSV path is retained behind aDeprecationWarning. Result at the v1.3 defaultn_per_region = 3: 18 / 23 selene sites match within 5 km of an in-scope Wueller site (78 % agreement); median match distance 1.71 km against 73 in-scope Wueller sites across 8 USGS regions. Six of eight regions agree at 100 % match-within-region; three regions (de Gerlache Rim 2, Mons Mouton Plateau, Slater Plain) have outliers that miss the threshold by ≤ 6 km. Test suite: 350 collected, 346 passed, 4 skipped (LEND-only). -
v1.4.2 —
n_per_regiondefault raised to 10 (matches Wueller's per-region site density). ✅ Defaultn_per_regionchanged from 3 to 10. The selene methodology converges at any per-region density: selene-to-Wueller match rate is essentially flat across n (78 % at n=3, 78 % at n=5, 80 % at n=10), but Wueller-to-selene match rate climbs from 41 % to 63 % as more selene sites become available to pair with Wueller's 73-site in-scope catalog. Result at the new default: 56/70 selene sites (80 %) match within 5 km of an in-scope Wueller site; median match distance 1.88 km; 46/73 (63 %) of in-scope Wueller sites match a selene site within 5 km. Two regions (Mons Mouton, Peak Near Cabeus B) reach 100 % match-within-region at n=10; Nobile Rim 1 and Nobile Rim 2 reach 80 %+. de Gerlache Rim 2 stays at 0/2 (the polygon's HLS-eligible area caps at 2 sites at 2km NMS — its terrain is genuinely far from Wueller's dGR2 cluster, independent of n). Per-region site counts (NMS-capped at 2km separation): HW 10, MM 10, MMP 10, NR1 10, NR2 10, PCB 9, SP 9, dGR2 2 — total 70. -
v1.5 — 20 m Wueller-class resolution with GPU acceleration. ✅ Per-region tiled driver runs the HLS filters at 20 m, the same native LOLA resolution Wueller et al. 2026 use. New CLI flags
--tiled-per-region --resolution 20onselene preprocessandselene rank-per-region; new GPU path throughderive_horizon_profileandcompute_earth_visibility_fractionvia CuPy +cupyx.scipy.ndimage.map_coordinates; newpipeline/preprocess_tiled.pyandpipeline/rank_per_region_tiled.pycovering each USGS polygon's bbox + 100 km horizon buffer with explicit cupy memory-pool drain between tiles. The 240 m global path is unchanged. Result against Wueller 2026 at 20 m: 56/69 selene sites (81 %) match within 5 km, median matched-pair distance 1.76 km — tighter than v1.4.2's 1.88 km at 240 m by 6.5 %; selene-to-Wueller match rate flat (80 % → 81 %); Wueller-to-selene rate slips slightly (63 % → 60 %) because the finer slope/buffer re-ranks sites within MMP, SP, and CB to a different cell within the same polygon. Six of eight regions tighten or hold their median matched-pair distance at 20 m; Malapert Massif still has zero HLS-compliant cells (genuine steep terrain, not a 240 m sampling effect); de Gerlache Rim 2 still produces only 2 sites with 0/2 within 5 km of Wueller's dGR2 cluster (genuine terrain divergence, persists at fine resolution). The methodology converges at peer-reviewed resolution; the residual disagreements at v1.4.2 are not 240 m sampling artefacts. v1.5 is opt-in and requires a CUDA GPU plus ~140 GB unified-memory headroom (developed on NVIDIA GB10 / DGX Spark; full 9-region run ~32 min preprocess + ~22 min rank). See "Resolution analysis (v1.5 — 20 m Wueller-class)" above for the per-region table and side-by-side plots. -
v1.5.1 — Artemis IV mission designation update + NASA Figures-of-Merit framework citation. ✅ Docs-only patch release. NASA restructured the Artemis program in February 2026: the first crewed lunar landing at the south pole was reassigned from Artemis III to Artemis IV (target early 2028), Artemis III became an Earth-orbit test mission, and Lunar Gateway was canceled in March 2026. v1.5.1 reframes the project's forward-looking copy from "Artemis III" to "Artemis IV (formerly Artemis III)" across the README, the v1.5 catalog report, and user-facing CLI / module docstrings, while leaving citation titles, the USGS dataset name, NASA's October 2024 announcement URL, the Wueller 2026 paper's own framing, and the historical roadmap entries unchanged. Adds Lawrence 2025 (NASA NTRS 20250008952) as a reference and a new "Mapping to NASA's Figures of Merit framework" subsection in the Methodology section that maps selene's seven criteria to NASA's published FOM categories. The methodology, data, validation, and 69-site catalog are identical to v1.5; the headline numbers (56/69 = 81.2 % within 5 km, median 1.76 km) are unchanged.
-
v1.6 — 10 m exploratory analysis (deferred — three blockers identified). ⏸ Three independent technical blockers were identified across multiple v1.6 attempts in May 2026:
(1) Polygon coverage (data). PGDA's
LDEM_83S_10MPP_ADJmosaic covers latitudes −83° to −90° (~432.8 km × 432.8 km square, ±216.4 km from the south pole in polar-stereographic Moon coordinates). Of selene's 9 USGS Artemis IV candidate regions, only 3 (HW, SP, G2) fit cleanly inside the mosaic with the 100 km horizon-march buffer required by selene's LOS-to-Earth criterion. The remaining 6 polygons extend past the mosaic's coverage boundary — CB's buffered bbox over-runs the west edge by 74 km, N2's over-runs the east edge by 50 km, and N1, MM, MA, MP all over-run the north edge by 4–60 km. Truncating the buffer would bias the LOS visibility fraction asymmetrically and is not a tunable knob. PGDA's 5 m product (LDEM_87S_5MPP) covers only ~−87° to the pole and fits 1 of 9 polygons (G2). NAC stereo DEMs at 1–2 m (Bertone 2026, PGDA product 78) provide finer resolution per ROI but require a per-ROI driver distinct from selene's polygon-tiled flow.(2) File-resolver gap (closed in v1.8.3). The pre-v1.8.3 LOLA source resolver was hardcoded to PDS naming patterns (
ldem_80s_<resolution>m.lbl). PGDA-format mosaics likeldem_83s_10mpp_adj.tifwould silently fall through to the 20 m PDS file resampled to a 10 m analysis grid — interpolation theatre rather than a true higher-resolution run. v1.8.3 closes this with the--lola-source PATHflag onselene preprocess --tiled-per-region.(3) Memory ceiling at 10 m + 100 km buffer (closed in v1.9). With v1.8.3's resolver fix and a clean re-download of the PGDA mosaic, a first 3-region 10 m diagnostic was attempted on the cleanly-covered polygons (HW, SP, G2). The preprocess died ~46 seconds into the first tile from kernel OOM, taking the entire tmux session with it (not just the Python process). Per-tile dimensions at 10 m + 100 km buffer are ~22000×22000 = 484 M pixels; the full
(36, height, width)float32 horizon profile output array is ~70 GB per tile before scratch buffers and CuPy memory-pool overhead. v1.5's 20 m tiles were ~11000×11000 = 121 M pixels with a ~17 GB output array — comfortable in the GB10's 119 GB unified memory. On unified-memory hardware, host RAM and GPU memory share the same physical pool, so a pure host-side accumulator for the per-azimuth chunked path also consumes the unified pool and provides no benefit by itself. v1.9 closes this with per-azimuth chunking + an mmap-backed disk accumulator: at fine resolutions the per-tile output array is opened withnp.lib.format.open_memmapagainst a temporary on-disk.npyfile, the chunked horizon-profile loop writes one azimuth slice at a time, peak in-memory footprint stays bounded by the per-chunk GPU buffer (~17 GB at 10 m / chunk=9), and a streamingnp.savez_compressedconverts the mmap to the final NPZ at the end. v1.5 behaviour is preserved verbatim at 240 m / 80 m / 20 m (auto-detected chunk size =n_azimuths).Blocker 1 (polygon coverage; 3 of 9 polygons fit cleanly with the 100 km buffer at 10 m) remains the structural reason v1.6 is not shipping as a release. The 10 m mosaic file remains on disk (
data/raw/lola/ldem_83s_10mpp_adj.tif, 4.77 GB, full-pixel-data checksum 41127). v1.9 (below) closes the engineering side: the 3-region 10 m run is now end-to-end feasible on the GB10 and the diagnostic numbers are landed in the v1.9 entry — methodology tightens vs 20 m on the cleanly-covered polygons (median matched-pair distance 1.88 km → 1.29 km, −31 %). -
v1.7 — TOPSIS aggregator as opt-in alternative to weighted_sum. ✅ Adds
scoring/aggregate.topsis(Hwang & Yoon 1981) as a sibling ofweighted_sum, withselene score --method topsisandselene rank-per-region --method topsisexposing it. Same input contract (per-criterion [0, 1] score grids + weights), same renormalise-on-missing-criteria semantics, same NaN propagation. Default staysweighted_sum— v1.5's 81.2 % / 1.76 km headline is unchanged. TOPSIS result on the v1.5 20 m catalog: same 69 sites (HLS filters identical), same top-5 by score, 55 / 69 (79.7 %) matched within 5 km of an in-scope Wueller site (vs 56 at weighted_sum), median matched-pair distance 1.84 km vs 1.76 km globally — but three of seven active regions tighten significantly (Haworth -0.51 km, Mons Mouton Plateau -0.40 km, Nobile Rim 1 -0.43 km) and max pair distance improves -0.22 km. Both aggregators agree on which cells are top-tier; they disagree at the 1.5–4 km margin. TOPSIS outputs land underdata/outputs/topsis/so the two catalogs sit side-by-side. See "Aggregator: weighted_sum vs TOPSIS" in Methodology for the full table. -
v1.8 — Activate seismic criterion (eight of eight criteria live). ✅ Adds distance-to-nearest-scarp as the eighth criterion via a logistic of distance to the nearest mapped lunar lobate scarp (midpoint 25 km, steepness 8 km — tuned to Civilini et al. 2023's documented shallow-moonquake-to-scarp clustering distance). Bundles the Mishra & Kumar (2022) south-polar scarp catalog (GRL doi:10.1029/2022GL098505, Zenodo doi:10.5281/zenodo.6624114, CC-BY 4.0) — 704 line segments combining Watters et al. (2015) global mapping with 75 new south-polar scarps Mishra & Kumar mapped from independent LROC NAC analysis — at
src/selene_base/criteria/data/scarps_mishra_kumar_2022/, with the original LROC SOCPOLAR_SCARP_LOCATIONSshapefile (citing Watters 2015 verbatim) bundled alongside as an attribution anchor atscarps_watters_2015_polar/. Default seismic weight 0.10, with the other seven weights scaled by 0.928 so the simplex still sums to 1.00. Methodology fully realised — eight of eight planned criteria contribute to the aggregate score. Result: 56 / 69 selene sites (81.2 %) match within 5 km of an in-scope Wueller site — identical to v1.5's headline; 46 / 73 (63.0 %) Wueller-side match (up from 44 / 73 in v1.5, +2.7 pp); median matched-pair distance 1.69 km vs 1.76 km in v1.5 (-0.07 km). Same site count, same top-3 in every region; 13 sites in HW/MMP/N1/N2 reshuffle within ranks 4-10. The criterion is most active where the Mishra/Kumar catalog has dense south-polar coverage and least active for cells far from any mapped scarp (most of the polar grid). See "Seismic criterion (v1.8)" in Methodology for the logistic scoring details and per-region table. -
v1.8.3 —
--lola-sourceflag for arbitrary LOLA source files. ✅ Adds an explicit source-path override toselene preprocess --tiled-per-regionand topipeline.preprocess_tiled.run_tiled_per_region, bypassing the PDS-naming priority list inresolve_lola_source(which previously hardcodedldem_80s_<resolution>m.lbland would not pick up alternative-format files). Enables the tiled pipeline to run against PGDA mosaics (e.g.ldem_83s_10mpp_adj.tif), NAC stereo DEMs, and arbitrary user-supplied DEMs without renaming files into the PDS naming convention. The override path is validated up front (must exist, be a file, and have a.tif/.lbl/.imgsuffix); when omitted, the existing auto-detect behaviour runs unchanged. Closes one of the v1.6 deferral blockers (the file-resolver gap surfaced when the 10 m PGDA mosaic was tried against the existing pipeline); the polygon-coverage blocker remains. Backward compatible — no methodology, data, or validation changes; v1.8 headline numbers (56/69 = 81.2 %, median 1.69 km) are unchanged. -
v1.9 — Per-azimuth chunking + mmap-backed accumulator (10 m unblocked end-to-end). ✅ Resolves v1.8.4's third v1.6 blocker (memory ceiling at 10 m + 100 km buffer on the GB10's 119 GB unified memory). Two coordinated changes across preprocess and rank, plus a cache-format change that ties them together. Preprocess side:
derive_horizon_profilenow accepts anazimuth_chunk_sizeparameter and anout=accumulator, processing azimuths in groups (chunk = 9 of 36 at 10 m → ~17 GB GPU working buffer instead of the full ~70 GB) and writing each azimuth slice into a caller-supplied numpy array.pipeline/preprocess_tiled.run_tiled_per_regionopens that accumulator withnp.lib.format.open_memmapagainst an on-disk.npyfile at fine resolutions, so the per-tile output never materialises in unified memory. Cache format: at v1.5 resolutions (240 m / 80 m / 20 m for 8 of 9 polygons) the unchunked path still writes a single<base>.npz; at fine resolutions the chunked path writes<base>.npy(mmap-able bulk array) plus a small<base>.meta.npz(azimuth_deg, x, y, bounds). Newexisting_horizon_cache_pathresolver picks whichever pair is on disk, preferring the.npyform. Rank side:_load_horizon_profile_npzmmap-loads the.npycache without decompressing it;criteria/los_to_earth.compute_earth_visibility_fractiongains arow_chunk_sizeparameter that iterates over y-slabs (~1500 rows at 10 m, ~5 GB working buffer per slab), uploading only the slab to GPU and callingmadvise(MADV_DONTNEED)between slabs to evict the OS page cache. Lat / lon / grid-convergence fields downcast to float32 (sub-cm precision over a 220 km tile, well below 10 m) to halve persistent rank-tile memory. New CLI flags:--azimuths-per-chunk INTEGERonselene preprocess --tiled-per-region, and--lola-sourceonselene rank-per-region(matching v1.8.3's preprocess flag so a single PGDA mosaic flows through both stages). Auto-detect per-tile chunk size inpipeline.preprocess_tiled.default_azimuth_chunk_size. Chunked + mmap path is numerically identical to the v1.5 single-pass path within float32 precision (verified across 21 synthetic-data tests intests/test_per_azimuth_chunking.py).10 m end-to-end diagnostic on the 3 cleanly-covered USGS polygons (HW, SP, G2):
metric v1.5 (20 m, 3 regions) v1.9 (10 m, 3 regions) Δ total selene sites 20 18 −2 selene matched within 5 km 13 (65.0 %) 11 (61.1 %) −3.9 pp Wueller matched within 5 km (in-scope, 3 regions) 11 / 29 (37.9 %) 11 / 29 (37.9 %) 0.0 median matched-pair distance 1.88 km 1.29 km −0.59 km / −31 % max matched-pair distance 3.38 km 3.38 km ~0 Per-region: HW 10/10 sites both, matched 8 → 7, median 1.77 → 1.16 km (−34 %); SP 8 → 7 sites, matched 5 → 4, median 2.03 → 1.77 km (−13 %); G2 2 → 1 sites, matched 0 → 0 (terrain-driven, persists from v1.5 — finer resolution doesn't manufacture HLS-eligible cells where the polygon's slope distribution genuinely doesn't have them). The drop in selene-side site count is the expected consequence of HLS filters at 10 m: micro-topography that gets averaged out at 20 m bilinear-resamples now triggers slope > 8° rejections, so fewer cells survive; the cells that do survive are the geometric cores of the polygon's eligible terrain and coincide more tightly with Wueller's catalog. The Wueller-side match count is unchanged at 11 / 29 — same Wueller sites are matched, just to fewer-but-tighter selene partners. Wall-clock on GB10: preprocess 38 min, rank 28 min, compare 3 s = ~1 h 8 m for the full 10 m diagnostic. v1.5/v1.7/v1.8 headline numbers (56/69 = 81.2 %, median 1.69 km, full 9-region 20 m run) and methodology, default weights, and aggregate-score behaviour are unchanged. v1.6 itself remains deferred only on blocker 1 (polygon coverage; 3 of 9 polygons fit at 10 m); v1.9 closes the engineering gap and demonstrates the methodology converges (tightens, in fact) at 10 m on the polygons where data is available.
-
v2.0 — EVA-disc PSR access criterion (first NASA-HLS-alignment release). ✅ First v2.x major-version release. Replaces the v1.x global spatial-coupling product (
distance_to_PSR × distance_to_sunlit_ridge, multiplicative) with per-cell EVA-disc PSR access: the fraction of cells inside a 2 km walking-EVA radius whose Diviner PRP annual maximum temperature stays below 110 K (water-ice stability ceiling). Mirrors NASA's documented walking-EVA framing —EVA-EXP-0070 Rev Ddocuments the 2 km radius, the Lawrence (2025) Figures-of-Merit framework names "Crew EVA" as a first-class FOM category, and the A3GT priorities at LPSC 2025 reiterate the 2 km disc as the operational target for site-internal mobility planning. The cold-class threshold (110 K) is the standard water-ice stability ceiling from Paige et al. 2010 (Diviner team) and Hayne et al. 2015. The new criterion is implemented as a single circular-kernelscipy.ndimage.convolveagainst the existingdiviner_temp_maxCOG (already produced byselene preprocess); the legacycriteria/coupling.pymodule andselene coupling-sweeputility remain in tree for sensitivity analysis. Weight slot is unchanged (0.17, the same value v1.x used forcoupling) so any catalog-level shift attributable to the swap reflects the new criterion's geometry, not a re-weighting of the simplex. Plus: Wueller per-launch-year HLS cross-check. A new validation lens, not a re-ranking: for every selene site that matched a Wueller 2026 site within 5 km, look up the matched Wueller site's bundledSunDays25..SunDays32columns (8 launch years, already in the in-repo Zenodo deposit's DBF) and report whether each year clears NASA's HLS continuous-lit threshold (≥ 10 Earth-days). Headline number is the 2028 pass count — Artemis IV's target launch year. Output lands atdata/outputs/v2/wueller_comparison_with_launch_year.json. v2.0 vs v1.9 catalog comparison (20 m per-region tiled, all eight criteria active, default weights):metric v1.9 (coupling) v2.0 (eva_psr_access) Δ selene sites 69 69 0 selene matched within 5 km 56 (81.2 %) 55 (79.7 %) −1 (−1.5 pp) Wueller matched within 5 km 46 (63.0 %) 44 (60.3 %) −2 (−2.7 pp) median matched-pair distance 1.69 km 1.84 km +0.15 km (+8.9 %) Of 69 v2.0 sites, 59 are within 10 m of a v1.x site (identical re-pick), 7 are reranked 0–5 km within their polygon (small score-gradient adjustments), and 3 are reranked > 5 km (a real geometry shift — those sites are now closer to a cell whose 2 km EVA disc captures a larger cold-class PSR area than v1.x's PSR-distance × ridge-distance product preferred). Per-region: site counts are identical to v1.9 (no Δ in any region's HLS-eligible count); the rerank concentrates in Nobile Rim 2 (6 identical, 1 moved 1–5 km, 2 moved > 5 km), Haworth (7 identical, 1 moved 1–5 km, 1 moved > 5 km), and Mons Mouton Plateau (8 identical, 1 moved < 1 km, 1 moved 1–5 km); N1, CB, SP, G2 are unchanged from v1.x site-by-site. v2.0 240 m baseline (full 240 m run, 70-site catalog): 56 / 70 selene sites (80.0 %) match within 5 km; median 1.88 km; 45 / 73 (61.6 %) Wueller-side. Per-launch-year HLS cross-check (20 m, matched sites): 22 / 55 pass HLS for 2028 (Artemis IV); 52 / 55 pass HLS in at least one launch year 2025–2032; per-year pass counts: 43 / 23 / 24 / 22 / 32 / 30 / 19 / 43 across 2025–2032. The 2028 number is the headline — it's the Artemis IV target launch year. Two v2.x items deferred indefinitely on data availability: the continuous-lit illumination metric (PGDA hourly cube not distributed) and the rock-abundance safety filter (all public Diviner rock-abundance products clip at ±60–70°, excluding the pole). v2.0 ships with what's actually achievable from data already in the repo; both deferred items remain candidates pending data release.
-
v2.1 — Multi-class volatile criterion (NASA-alignment Gap #3). ✅ Replaces the v1.x single
icecriterion (PRP ice-depth + PSR-proximity bonus combined into one [0, 1] score) with three-class volatile access: H₂O cold trap (temp_max < 110 K), CO₂/NH₃ cold trap (temp_max < 66 K), and ultra-cold (temp_max < 60 K) — three sub-scores, each the fraction of cells inside the same 2 km EVA disc that satisfy that class's threshold, combined as an unweighted mean. Mirrors NASA's documented volatile-diversity priority (Lawrence 2025 FOM names "volatile diversity" as a first-class FOM category) and Wueller 2026's per-class treatment in the peer-reviewed reference. Cold-class thresholds come from the published Diviner literature: 110 K is the standard water-ice stability ceiling (Paige et al. 2010; Hayne et al. 2015); 66 K is the freezing temperature for solid CO₂ and the upper bound for stable solid NH₃ under polar conditions; 60 K is the deepest-trap regime where exotic volatiles (HCN, CH₃OH) survive on geologic timescales (Hayne et al. 2020 micro-cold-trap classification). The thresholds are nested (60 K ⊂ 66 K ⊂ 110 K) so by constructionultracold_score ≤ co2_nh3_score ≤ h2o_scoreper cell. Equal sub-weights (1/3 each) by default — agnostic on NASA's preference ordering between volatile classes, withsub_weights=exposed for downstream sensitivity (e.g. an H₂O-priority alternative(0.5, 0.3, 0.2)). Implementation reuses v2.0's circular-kernelscipy.ndimage.convolvepattern, runs once overdiviner_temp_maxwith three threshold masks; per-class component COGs (multi_volatile_score_h2o,_co2_nh3,_ultracold) are persisted alongside the combined score for diagnostic visibility — the per-class breakdown surfaces which sites access multiple volatile classes vs single. The legacycriteria/ice.pymodule stays in tree for sensitivity / comparison utilities. Weight slot unchanged (0.17, the same value v1.x used forice) so the v2.0 → v2.1 comparison is methodology-only.v2.1 vs v2.0 catalog comparison (20 m per-region tiled, all eight criteria active, default weights):
metric v2.0 (ice) v2.1 (multi_volatile) Δ selene sites 69 69 0 selene matched within 5 km 55 (79.7 %) 54 (78.3 %) −1 (−1.4 pp) Wueller matched within 5 km 44 (60.3 %) 43 (58.9 %) −1 (−1.4 pp) median matched-pair distance 1.84 km 1.84 km 0 km Of 69 v2.1 20 m sites, 30 are within 10 m of a v2.0 site (identical re-pick), 24 reranked < 1 km, 15 reranked 1–5 km, 0 reranked > 5 km. The per-region rerank is broader than v2.0's coupling → eva_psr_access swap (which had 59 of 69 identical) — multi_volatile's stricter equal-weighted-three-class scoring pulls the aggregate down where only the H₂O class is accessible, so sites that were on the H₂O-only rim re-rank toward the same polygon's deeper-trap shoulders. Per-region: site counts unchanged (no Δ in any region's HLS-eligible count); rerank is widest in Mons Mouton Plateau (2 identical, 1 < 1 km, 7 reranked 1–5 km), Haworth (3 identical, 5 < 1 km, 2 reranked 1–5 km), and Nobile Rim 1 (2 identical, 5 < 1 km, 3 reranked 1–5 km); Nobile Rim 2 is most stable (7 identical). Per-region match rate moves: Mons Mouton Plateau median tightens 2.26 → 1.65 km (-27 %); Nobile Rim 1 picks up 1 additional matched site (8 → 9). v2.1 240 m baseline: 70 sites (was 70 at v2.0); 52 / 70 (74.3 %) selene match (was 80.0 %); 42 / 73 (57.5 %) Wueller-side (was 61.6 %); median 1.87 km (was 1.88 km, flat). Per-launch-year HLS cross-check (20 m, matched sites): 23 / 54 pass HLS for 2028 (Artemis IV); 52 / 54 pass HLS in at least one launch year 2025–2032; per-year pass counts: 43 / 23 / 25 / 23 / 31 / 29 / 20 / 42 across 2025–2032.
Per-class component breakdown — the substantive new content of v2.1. Sampling the per-class component COGs at each of the 69 sites (threshold ≥ 5 % disc-fraction in a class to count as "accessing" that class):
access pattern n sites regions all three classes (H₂O + CO₂/NH₃ + ultra-cold within 2 km) 0 — two classes (H₂O + CO₂/NH₃, no ultra-cold) 1 Nobile Rim 2 H₂O only 5 Nobile Rim 2 (3), Haworth (1), Mons Mouton (1) no cold-class neighbour within 2 km EVA disc 63 all 8 active regions This is the v2.1 finding that the v1.x single
icecriterion couldn't surface: selene's HLS-compliant catalog is overwhelmingly a rim-band catalog, not a PSR-floor catalog. The HLS hard filters (slope ≤ 8°, illumination ≥ 33 %, DTE visibility ≥ 50 %) select for buildable, sunlit, comms-capable rim cells — but those cells sit 1–10 km from the deep PSRs that hold the colder volatile classes. Only Nobile Rim 2 has any sites with multi-class access (4 sites total: 1 with H₂O + CO₂/NH₃, 3 with H₂O-only); Mons Mouton Plateau, Nobile Rim 1, Peak Near Cabeus B, Slater Plain, and de Gerlache Rim 2 contain zero sites with cold-class access within 2 km EVA range. The 0 / 69 "all-three-classes" count isn't a criterion bug — it's a real terrain-driven finding about how the habitable-rim and the deepest-cold-trap floors are spatially separate at the south pole. Treating selene's catalog as ISRU-volatile-rich without this lens overstates its volatile accessibility; v2.1's per-class breakdown makes the gap explicit. (Caveat: the per-class component COGs are sampled at 240 m; a v2.x follow-on that runs the criterion at 20 m on the same per-region tiled grids the rank step uses would refine the count without changing the qualitative finding, since the 110 K / 66 K / 60 K cold-class fraction inside any 2 km disc is set by the temp_max field at the disc scale, not the sampling grid.)
Wueller 2026 deposit — non-point layers. The Zenodo deposit also contains an 884 MB HLS slope raster (HLS_LandingAreas_8°_-100m_buffer.tif), 2 km exploration-area polygons (ExplorationArea_2km.*), and an illumination-modelling layer set. None are bundled through v1.8 (point catalog only); folding any of them in (e.g. comparing selene's HLS-eligible mask against Wueller's 8°-buffer raster) is a near-term candidate.
v1.8 sensitivity rerun. The 200-sample Latin-hypercube weight sweep in Robustness was last run under the v1.5 seven-criterion vector. Re-running it on the v1.8 eight-criterion simplex (with seismic at 0.10) is a straightforward follow-up that would also refresh the diagnostic-comparison per-criterion table.
Finer-than-20 m public mosaic coverage at the polygon scope (the v1.6 blocker). v1.5 runs at 20 m on PDS's ldem_80s_20m (the south-pole 20 m polar mosaic) which covers all 9 USGS polygons with the full 100 km horizon-march buffer comfortably inside its extent. Going finer than 20 m at the same 9-polygon scope is gated on a public mosaic that doesn't currently exist:
- PGDA
LDEM_83S_10MPP_ADJ(10 m). ~432.8 km × 432.8 km square, ±216.4 km from the south pole. With the 100 km horizon-march buffer required by the LOS-to-Earth criterion, only 3 of 9 USGS polygons fit cleanly (HW, SP, G2). CB and N2 sit at the west/east longitudinal extremes and lose 50–75 km of buffer room; N1, MM, MA, MP all over-run the mosaic's north edge. - PGDA
LDEM_87S_5MPP(5 m). Wider-resolution but narrower-coverage product covering only ~87°S to the pole. With the 100 km buffer, only 1 of 9 polygons fits (G2). The other eight polygons all extend or buffer past 87°S and would lose substantial buffer or polygon coverage. - NAC stereo DEMs at 1–2 m. PGDA product 78 (Bertone 2026) provides per-ROI NAC stereo DEMs but is not polygon-tiled — would need a parallel integration path distinct from selene's polygon-tiled flow, or NAC stereo mosaic generation through ASP (Ames Stereo Pipeline) to produce a wider-coverage mosaic from the underlying NAC pairs.
A v2.x release at finer-than-20 m at the full 9-polygon scope depends on one of these becoming available or being constructed. A partial-coverage release at 10 m on (HW, SP, G2) was considered for v1.6 and rejected: with G2 contributing 0/2 matched-within-5 km against Wueller in v1.5, the comparison effectively collapses to two regions, which is too thin to be a release.
Tile-internal chunking architecture for ≤ 10 m analysis (closed in v1.9). v1.9 closes this with per-azimuth chunking + an mmap-backed disk accumulator (instead of spatial sub-tiling, which would require boundary-overlap stitching and is the more complex architecture). On unified-memory hardware the host-side accumulator strategy alone is insufficient because host RAM and GPU memory share the same physical pool — v1.9's mmap-backed accumulator pages writes to an SSD-resident temporary .npy file via np.lib.format.open_memmap, then streams the mmap into the final compressed NPZ via np.savez_compressed. Peak in-memory footprint stays bounded by the per-chunk GPU buffer (~17 GB at 10 m, chunk=9). Spatial sub-tiling is still potential v2.x work for any 5 m analysis that becomes data-feasible (NAC stereo DEM mosaics, future higher-latitude PGDA products), but per-azimuth chunking is sufficient at 10 m on the 3 cleanly-covered polygons.
- Auto-tune
--min-scorein the rank pipeline based on the aggregate's percentile distribution. - ML-based criterion inputs (planned as a separate project,
selene-vision).
- Robbins, S. J. (2019). A new global database of lunar impact craters >1–2 km: 1. Crater locations and sizes, comparisons with published databases, and global analysis. Journal of Geophysical Research: Planets, 124, 871–892. doi:10.1029/2018JE005592
- Mazarico, E., Neumann, G. A., Smith, D. E., Zuber, M. T., & Torrence, M. H. (2011). Illumination conditions of the lunar polar regions using LOLA topography. Icarus, 211(2), 1066–1081. doi:10.1016/j.icarus.2010.10.030
- Smith, D. E., et al. (2010). The Lunar Orbiter Laser Altimeter investigation on the Lunar Reconnaissance Orbiter mission. Space Science Reviews, 150(1–4), 209–241. doi:10.1007/s11214-009-9512-y
- Barker, M. K., Mazarico, E., Neumann, G. A., Smith, D. E., Zuber, M. T., & Head, J. W. (2021). Improved LOLA elevation maps for south pole landing sites: Error estimates and their impact on illumination conditions. Planetary and Space Science, 203, 105119. doi:10.1016/j.pss.2020.105119. (Source of the LOLA south polar 20 m DEM
ldem_80s_20mused as the elevation input for v1.5's per-region tiled high-resolution analysis.) - Paige, D. A., et al. (2010). The Lunar Reconnaissance Orbiter Diviner Lunar Radiometer Experiment. Space Science Reviews, 150(1–4), 125–160. doi:10.1007/s11214-009-9529-2
- Williams, J.-P., et al. (2017). The global surface temperatures of the Moon as measured by the Diviner Lunar Radiometer Experiment. Icarus, 283, 300–325. (PRP modeled-ice-stability methodology.)
- Diviner Polar Resource Product (PRP), south pole, version 1.0. PDS Geosciences Node Diviner derived bundle:
dlre_prp_south.tab. - Mitrofanov, I. G., et al. (2010). Hydrogen mapping of the lunar south pole using the LRO Neutron Detector Experiment LEND. Science, 330(6003), 483–486.
- Watters, T. R., Robinson, M. S., Banks, M. E., Tran, T., & Denevi, B. W. (2015). Global thrust faulting on the Moon and the influence of tidal stresses. Geology, 43(10), 851–854. doi:10.1130/G37120.1
- Civilini, F., Weber, R. C., Jiang, Z., Phillips, D., & Pan, W. (2023). Constraints on the seismic hazard of young thrust faults on the Moon from re-located shallow moonquakes. (Used as physical motivation + the order-10–50 km clustering-distance scale for v1.8's seismic-criterion logistic.)
- Mishra, A., & Kumar, P. S. (2022). Spatial and Temporal Distribution of Lobate Scarps in the Lunar South Polar Region: Evidence for Latitudinal Variation of Scarp Geometry, Kinematics and Formation Ages, Neo-Tectonic Activity and Sources of Potential Seismic Risks at the Artemis Candidate Landing Regions. Geophysical Research Letters, 49, e2022GL098505. doi:10.1029/2022GL098505. Data deposit: doi:10.5281/zenodo.6624114 (CC-BY 4.0). The 704 south-polar scarp line segments ship in-repo at
src/selene_base/criteria/data/scarps_mishra_kumar_2022/and are the primary data source for v1.8's seismic criterion. - Lobate-scarp catalog also distributed by the LROC Science Operations Center (NASA PDS LROLRC_2001 EXTRAS) as
POLAR_SCARP_LOCATIONS— citing Watters et al. 2015 verbatim. The 48-named-scarp polar shapefile ships in-repo atsrc/selene_base/criteria/data/scarps_watters_2015_polar/as an attribution anchor. - NASA (October 2024). Artemis III candidate landing regions. https://www.nasa.gov/feature/artemis-iii
- McClernan, M.T. (2024). Down Selected Artemis III Candidate Landing Site Navigational Grids. U.S. Geological Survey data release. https://doi.org/10.5066/P1MEQ6UK. The simplified region envelopes from this release ship in-repo at
src/selene_base/validation/data/nasa_regions_polygons_usgs.geojsonand are the authoritative validation reference from v1.2.0 onwards. - Gracy, S., & Lee, P. (2024). Update on the Artemis III Reference Mission and Candidate Landing Region Selection. 55th Lunar and Planetary Science Conference, Abstract #1695. (Source for the four published HLS hard-constraint thresholds used by v1.3.0's
rank-per-region— slope, slope-buffer, illumination, DTE visibility.) - Lawrence, S. (2025). Artemis IV Landing Site Process Overview. NASA Lunar Site Selection Workshop, NTRS document 20250008952. https://ntrs.nasa.gov/citations/20250008952. (Documents NASA's 5-step iterative site-selection process and the multi-directorate Figures of Merit (FOM) framework. Specific FOM weight values are not publicly disclosed; selene-base's "Mapping to NASA's Figures of Merit framework" subsection in Methodology positions the project's seven criteria against this published conceptual framework. Also cited as the framework reference for v2.0's EVA-disc PSR access criterion.)
- NASA (2024). EVA-EXP-0070 Rev D — Lunar Surface EVA Capability Spec. (Documents the 2 km nominal walking-EVA radius for Artemis-class crew operations. Cited as the geometric basis for v2.0's per-cell EVA-disc integration.)
- A3GT (2025). Artemis III Geology Team priorities. 56th Lunar and Planetary Science Conference. (Reiterates the 2 km walking-EVA disc as the operational target for site-internal mobility planning.)
- Paige, D. A., et al. (2010). Diviner Lunar Radiometer observations of cold traps in the Moon's south polar region. Science, 330(6003), 479–482. doi:10.1126/science.1187726. (Source of the 110 K water-ice stability ceiling used as v2.0's
cold_threshold_kdefault; cells whose annual maximum temperature stays below 110 K can hold water ice on geologic timescales.) - Hayne, P. O., et al. (2015). Evidence for exposed water ice in the Moon's south polar regions from LRO ultraviolet albedo and temperature measurements. Icarus, 255, 58–69. doi:10.1016/j.icarus.2015.03.032. (Independent corroboration of the cold-class temperature regime that hosts surface water ice; secondary citation for v2.0's cold-class threshold.)
- Hayne, P. O., et al. (2020). Micro cold traps on the Moon. Nature Astronomy, 5(2), 169–175. doi:10.1038/s41550-020-1198-9. (Source of v2.1's three-class volatile thresholds — H₂O ≤ 110 K, CO₂/NH₃ ≤ 66 K, ultra-cold ≤ 60 K — for the deepest exotic-volatile traps. Documents the nested temperature regimes that host different volatile species on geologic timescales.)
- Wueller, F., et al. (2026). Assessing Potential Landing Sites With Favorable Illumination and Accessible, Potentially Volatile-Rich Permanently Shadowed Regions Within Artemis Candidate Landing Regions. Journal of Geophysical Research: Planets, 131. doi:10.1029/2025JE009434. (Peer-reviewed parallel: 130 candidate Artemis III landing sites identified by within-region selection with NASA HLS hard filters. v1.3.0's
rank-per-regionmirrors the outer framing; v1.4.1+ ships the quantitative comparison against this catalog — see README §"Quantitative comparison against Wueller et al. 2026".) - Wueller, L., Berger, L. M., Christopher, H., Sugimoto, K., Thaker, A., Carton, L., Jo, W., Lee, S., Pedrelli, R., Sanchez, P., & Kring, D. (2025). Complementary Data for Wueller et al. (2026): Assessing Potential Landing Sites with Favorable Illumination and Accessible, Potentially Volatile-Rich Permanently Shadowed Regions within Artemis Candidate Landing Regions (Version v1) [Data set]. Zenodo. doi:10.5281/zenodo.17084058. (CC-BY 4.0 data deposit accompanying the JGR paper. The 130-site point catalog ships in-repo at
src/selene_base/validation/data/wueller_2026/and is the comparison reference from v1.4.1 onwards.) - NASA (2019). Human Landing System Requirements Document. (Underlying source for the HLS slope, slope-buffer, illumination, and DTE-visibility thresholds.)
MIT — see LICENSE.