





Key Features • Get Access • Installation • Usage • License
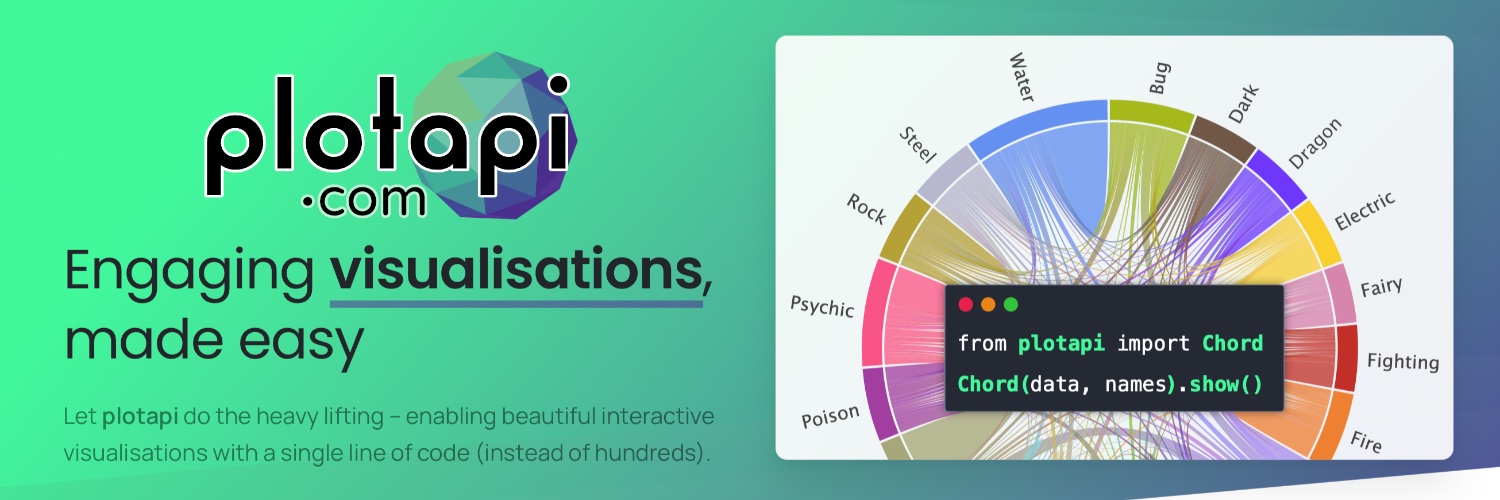
- Plotapi Chord - Illustrate inter-relationships between data.
- Plotapi Sankey - Illustrate the flow from one set of values to another.
- Plotapi Terminus - Illustrate distributing something out amongst recipients.
- Plotapi Bar Fight - A beautiful take on the classic Bar Chart Race.
- Plotapi Pie Fight - A beautiful take on the classic Pie Chart Race.
- Plotapi Heat Map - Beautiful and interactive heat maps.
- Plotapi Line Fight - A beautiful take on the classic Line Chart Race.
- Plotapi Pareto Front - Illustrate non-dominated (Pareto) fronts over time.
- Upcoming Visualisations - Access to new visualisations as they are introduced.
- Supports Most Programming Languages - Get started with any language able to make HTTP requests.
- First-Class Python Support - Get started with pip install plotapi
- Jupyter Lab/Notebook + Google Colab Support - Super-charge your notebooks with inline visualisations.
- Beautiful Themes & Fonts - Select from pre-made beautiful themes, or add your own.
- Share or Embed Interactive HTML - Download and embed your interactive visualisations.
- Render to PDF, SVG, or PNG - Generate high-quality output ready for print.
- Record Animation to Video - Create social media-ready animated visualisations.
Visit the website to get access to Plotapi.
Get up and running with Rust with the plotapi crate.
out.mp4
use plotapi::params;
use plotapi::Visualisation;

fn main() {
    let names: Vec<String> = vec!["A", "B", "C", "1", "2", "3"]
        .into_iter()
        .map(String::from)
        .collect();

    let matrix: Vec<Vec<f64>> = vec![
        vec![0.0, 0.0, 0.0, 1.0, 4.0, 1.0],
        vec![0.0, 0.0, 0.0, 1.0, 3.0, 2.0],
        vec![0.0, 0.0, 0.0, 1.0, 2.0, 2.0],
        vec![1.0, 1.0, 1.0, 0.0, 0.0, 0.0],
        vec![4.0, 3.0, 2.0, 0.0, 0.0, 0.0],
        vec![1.0, 2.0, 2.0, 0.0, 0.0, 0.0],
    ];

    let colors: Vec<String> = vec![
        "#7400B8", "#5E60CE", "#5684D6", "#56CFE1", "#64DFDF", "#80FFDB",
    ]
    .into_iter()
    .map(String::from)
    .collect();

    let param = params!({
        "matrix": matrix,
       "names": names,
       "colors":  colors

    });

    Visualisation {
        api_key: "17ec2f26-076c-4110-a23a-9a02efe2d52a",
        params: param,
        endpoint: "chord",
    }
    .to_html();
}sankey.mp4
MIT
Prefer not to code? Check out the App at PlotAPI.com. Python version available.

plotapi.com · GitHub @shahinrostami · Twitter @shahinrostami · A Polyra innovation